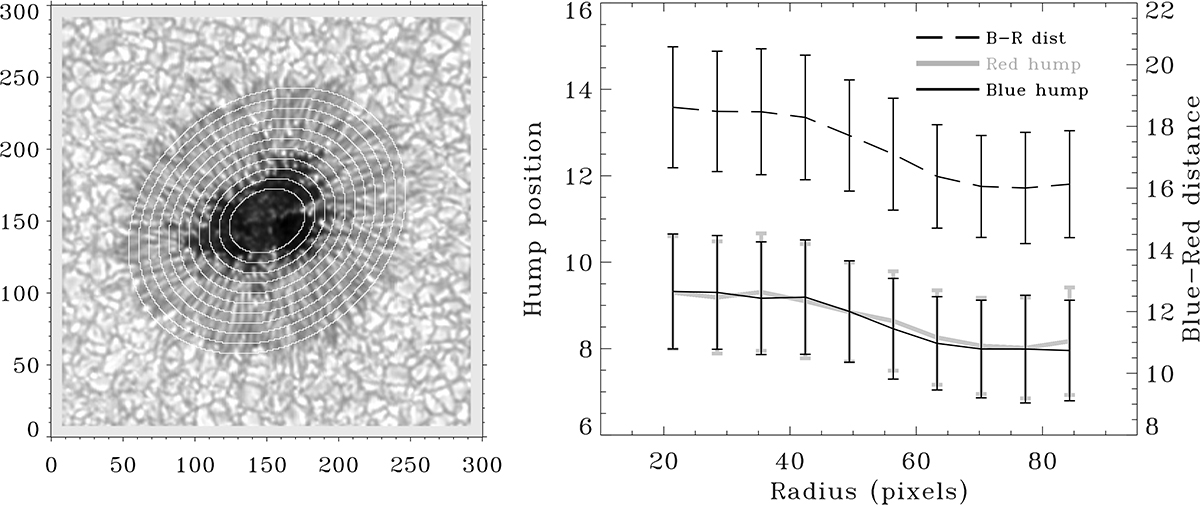
Fig. 15.
Download original image
Radial variations of the blue and the red hump positions and of the blue-red hump distance. Left panel: continuum intensity map. Right panel: distance of the red and the blue humps (gray and black solid lines, respectively) from a zero-velocity reference for the first spectral line as well as the distance between them (dashed line) versus the geometric distance from the sunspot center (radius). Each data point in the right panel illustrates the average of the quantities in the defined white rings in the left panel. Error bars show the standard deviation of each quantity in each ring.
Current usage metrics show cumulative count of Article Views (full-text article views including HTML views, PDF and ePub downloads, according to the available data) and Abstracts Views on Vision4Press platform.
Data correspond to usage on the plateform after 2015. The current usage metrics is available 48-96 hours after online publication and is updated daily on week days.
Initial download of the metrics may take a while.