Fig. 12.
Download original image
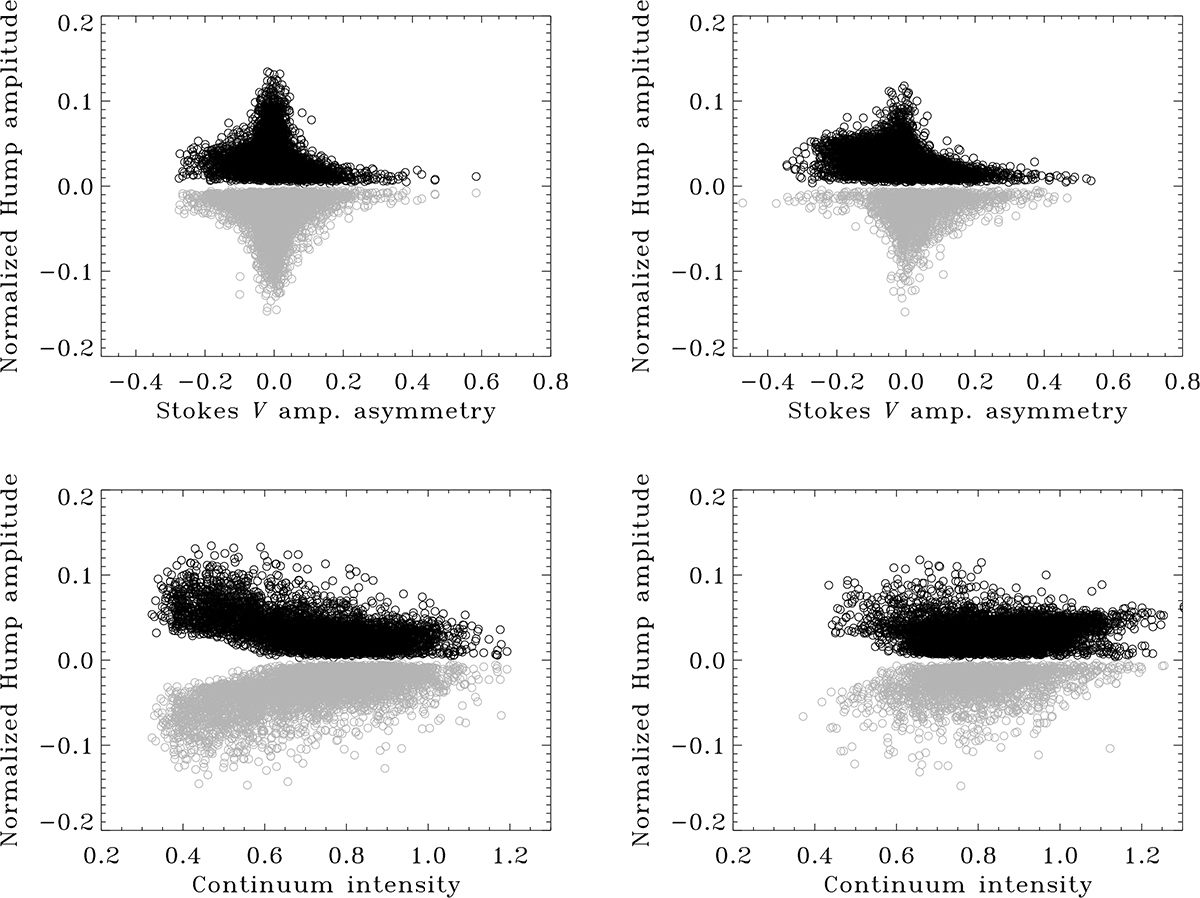
Some scatter plots to investigate possible correlations. Upper row: scatter plots of normalized hump amplitudes versus Stokes V amplitude asymmetry for the first spectral line. Lower row: scatter plots of hump amplitude versus the corresponding continuum intensity. Left column: Plot for the pixels in which the extra hump is seen on both the blue (black circles) and the red (gray circles) lobe. Right column: Plot for the pixels where the extra hump is seen on either the blue (black circles) or the red (gray circles) lobe.
Current usage metrics show cumulative count of Article Views (full-text article views including HTML views, PDF and ePub downloads, according to the available data) and Abstracts Views on Vision4Press platform.
Data correspond to usage on the plateform after 2015. The current usage metrics is available 48-96 hours after online publication and is updated daily on week days.
Initial download of the metrics may take a while.