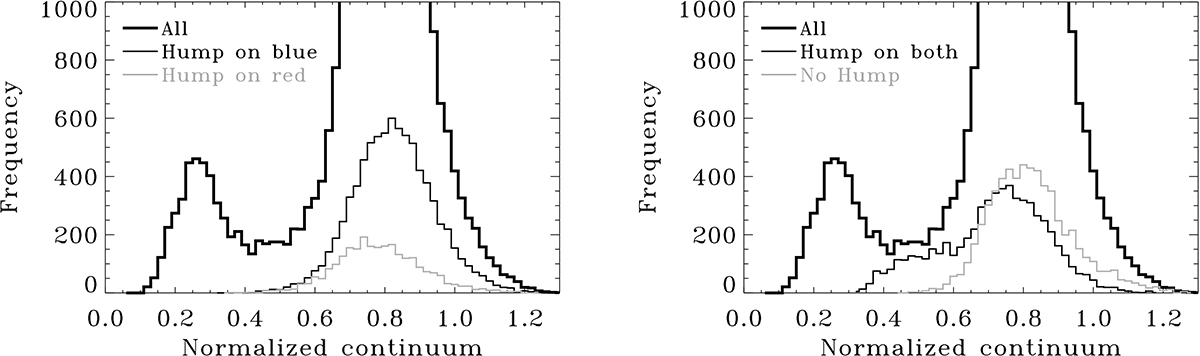
Fig. 10.
Download original image
Continuum intensity histogram of all penumbra pixels of the studied area. Left panel: histogram of the continuum intensity for pixels whose Stokes V profiles show only an extra blue (thin-black) or red (thin-gray) hump. Right panel: continuum intensity histogram of the pixels where the extra hump is seen on both the blue and the red lobe (thin-black), and the pixels where it is not seen on either lobe (thin-gray). For a better comparison, the vertical axis range is shortened from zero to 1000.
Current usage metrics show cumulative count of Article Views (full-text article views including HTML views, PDF and ePub downloads, according to the available data) and Abstracts Views on Vision4Press platform.
Data correspond to usage on the plateform after 2015. The current usage metrics is available 48-96 hours after online publication and is updated daily on week days.
Initial download of the metrics may take a while.