Fig. 8.
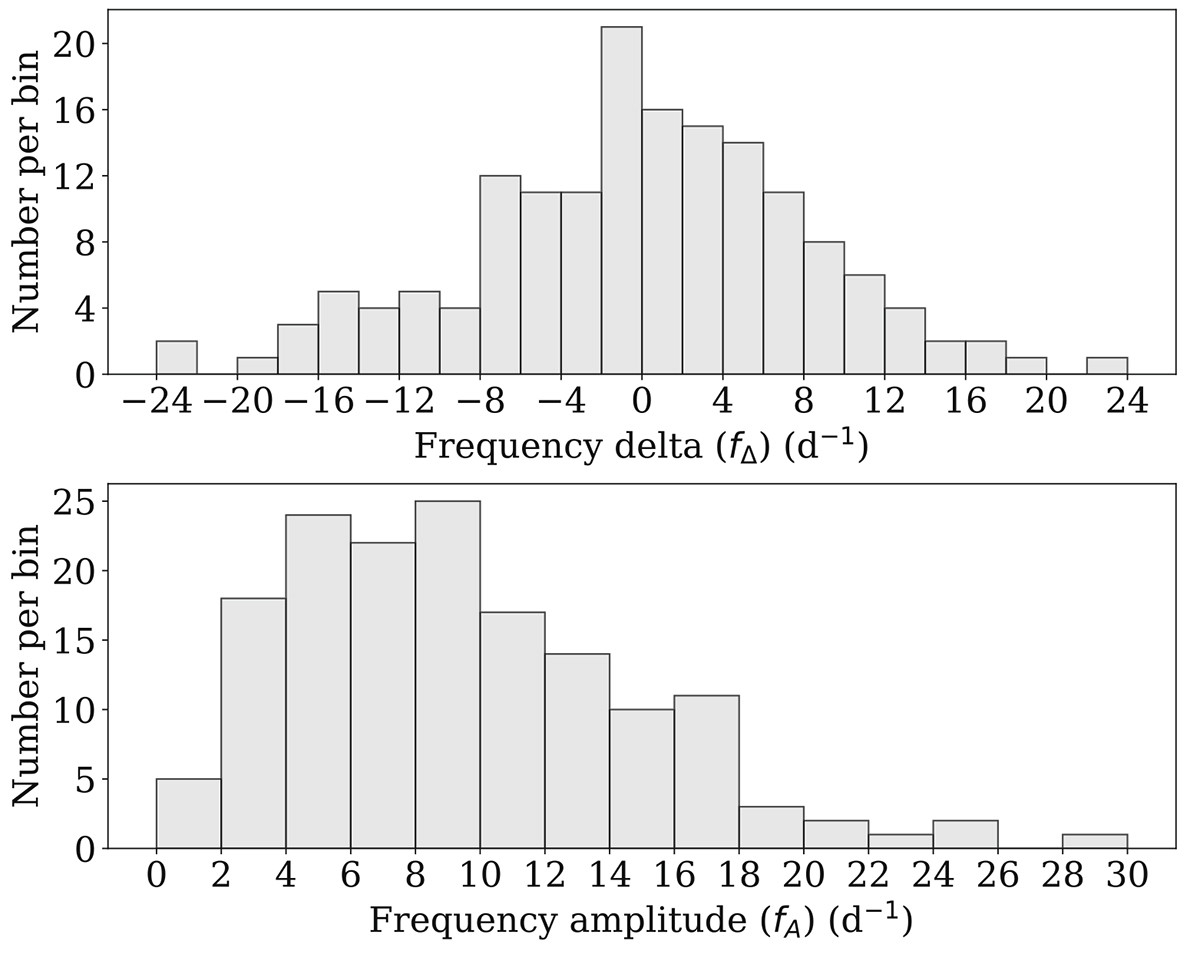
Download original image
Histograms for P ≥ 0.10. The frequency delta (fΔ) histogram in the top panel shows a peak near zero, which means that many groups end at the same frequency in which they started. Data points under −22 d−1 were added to an underflow bar. The frequency amplitude (fA) histogram in the bottom panel shows that most groups show changes in frequency throughout their duration. Both fΔ and fA are described in Sect. 2.2.
Current usage metrics show cumulative count of Article Views (full-text article views including HTML views, PDF and ePub downloads, according to the available data) and Abstracts Views on Vision4Press platform.
Data correspond to usage on the plateform after 2015. The current usage metrics is available 48-96 hours after online publication and is updated daily on week days.
Initial download of the metrics may take a while.