Open Access
Fig. 6.
Download original image
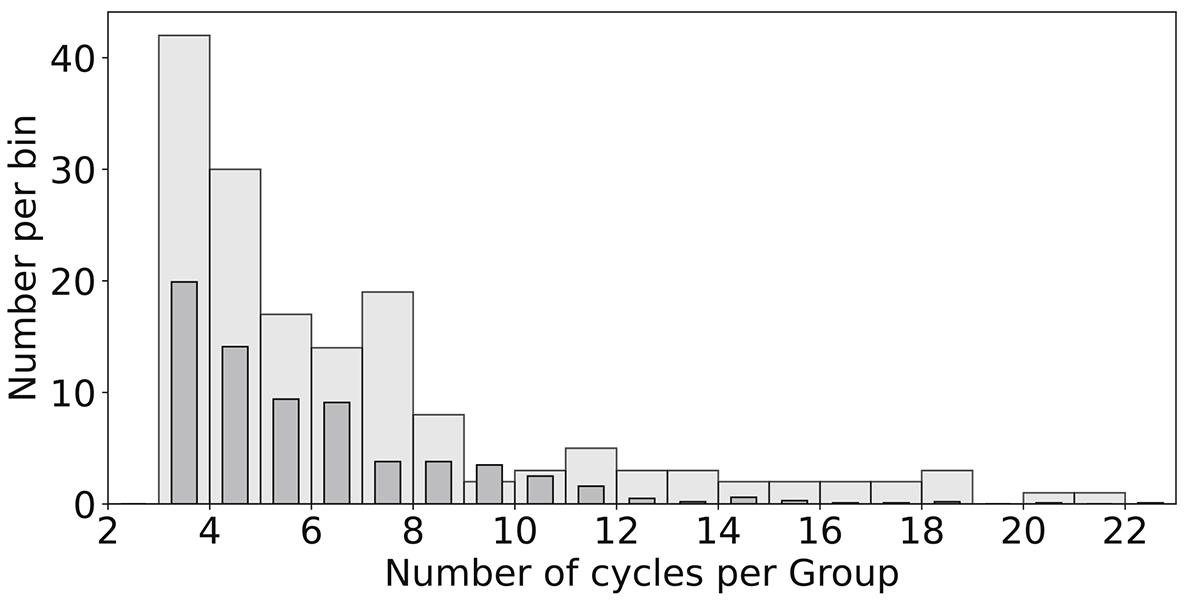
Number of completed cycles Nc for P ≥ 0.10. Light grey: Histogram for the 160 groups of the residual data. On average, a group can complete seven cycles before shifting to other frequencies. Thin dark grey: Duration histogram for randomised data. Groups made from random data complete fewer cycles on average.
Current usage metrics show cumulative count of Article Views (full-text article views including HTML views, PDF and ePub downloads, according to the available data) and Abstracts Views on Vision4Press platform.
Data correspond to usage on the plateform after 2015. The current usage metrics is available 48-96 hours after online publication and is updated daily on week days.
Initial download of the metrics may take a while.