Fig. 4.
Download original image
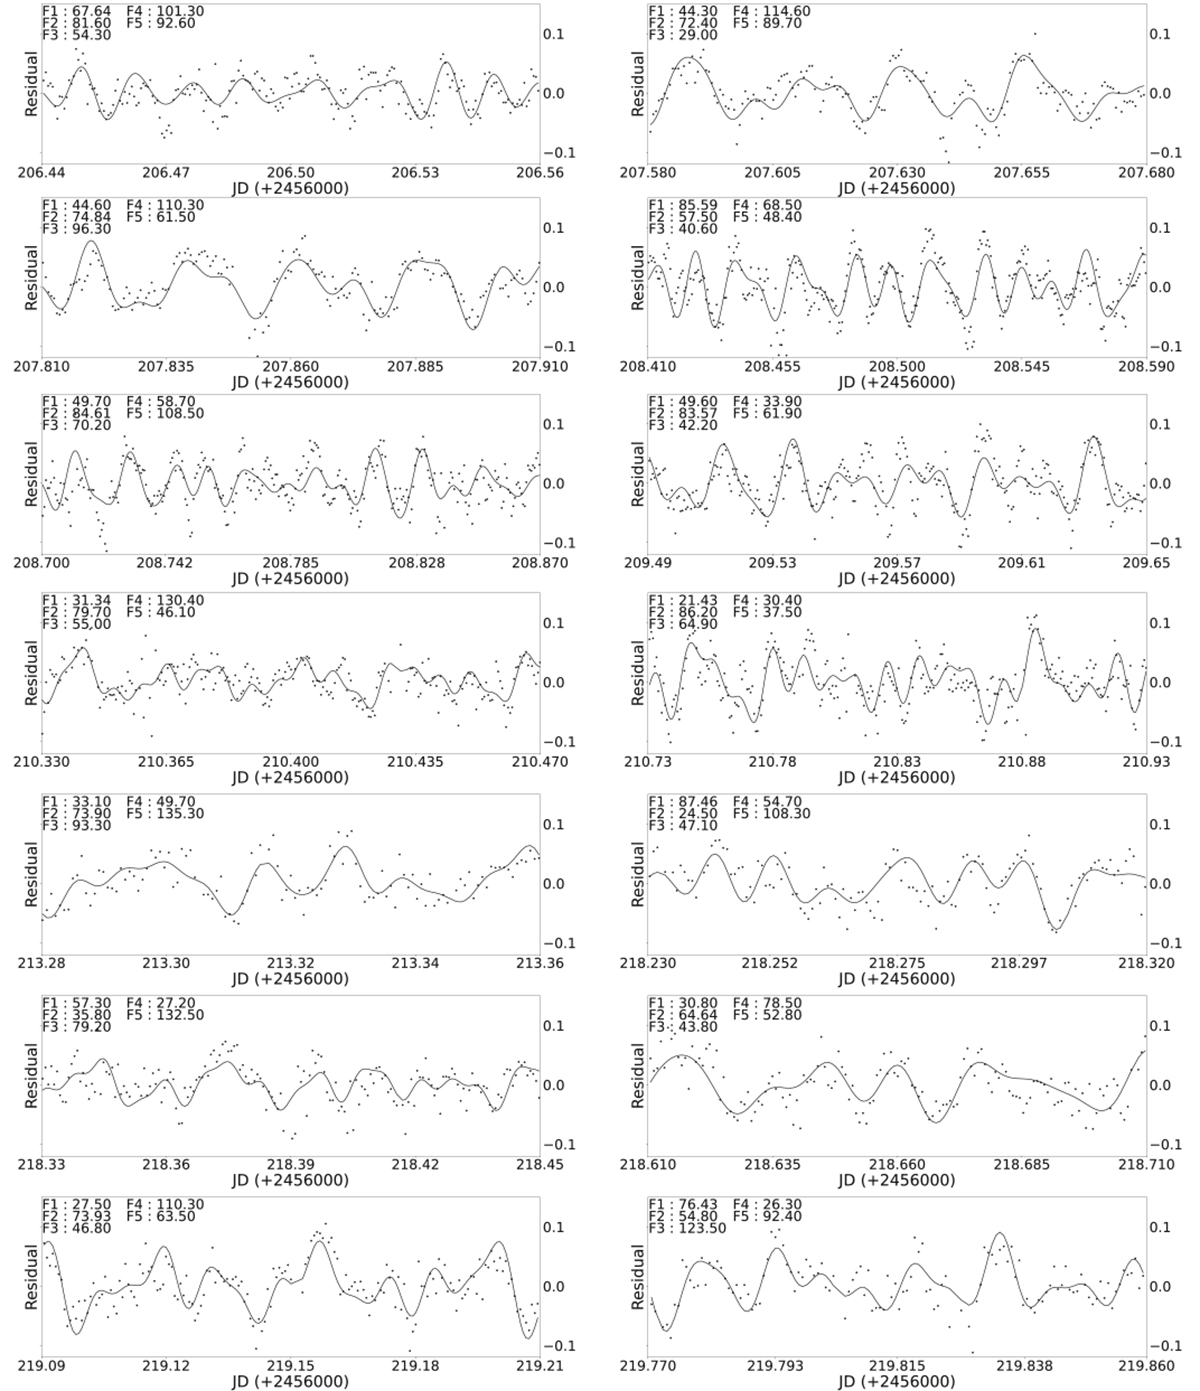
Multiple time intervals from TT Ari’s light curve, and a sinusoidal curve overlay. Each panel shows a different frequency group. The curve is made using a combination of five significant frequencies extracted from the power-spectrum for that segment. Here, F1 corresponds to the most relevant frequency in the power spectrum, with each following frequency having diminished impact on the curve.
Current usage metrics show cumulative count of Article Views (full-text article views including HTML views, PDF and ePub downloads, according to the available data) and Abstracts Views on Vision4Press platform.
Data correspond to usage on the plateform after 2015. The current usage metrics is available 48-96 hours after online publication and is updated daily on week days.
Initial download of the metrics may take a while.