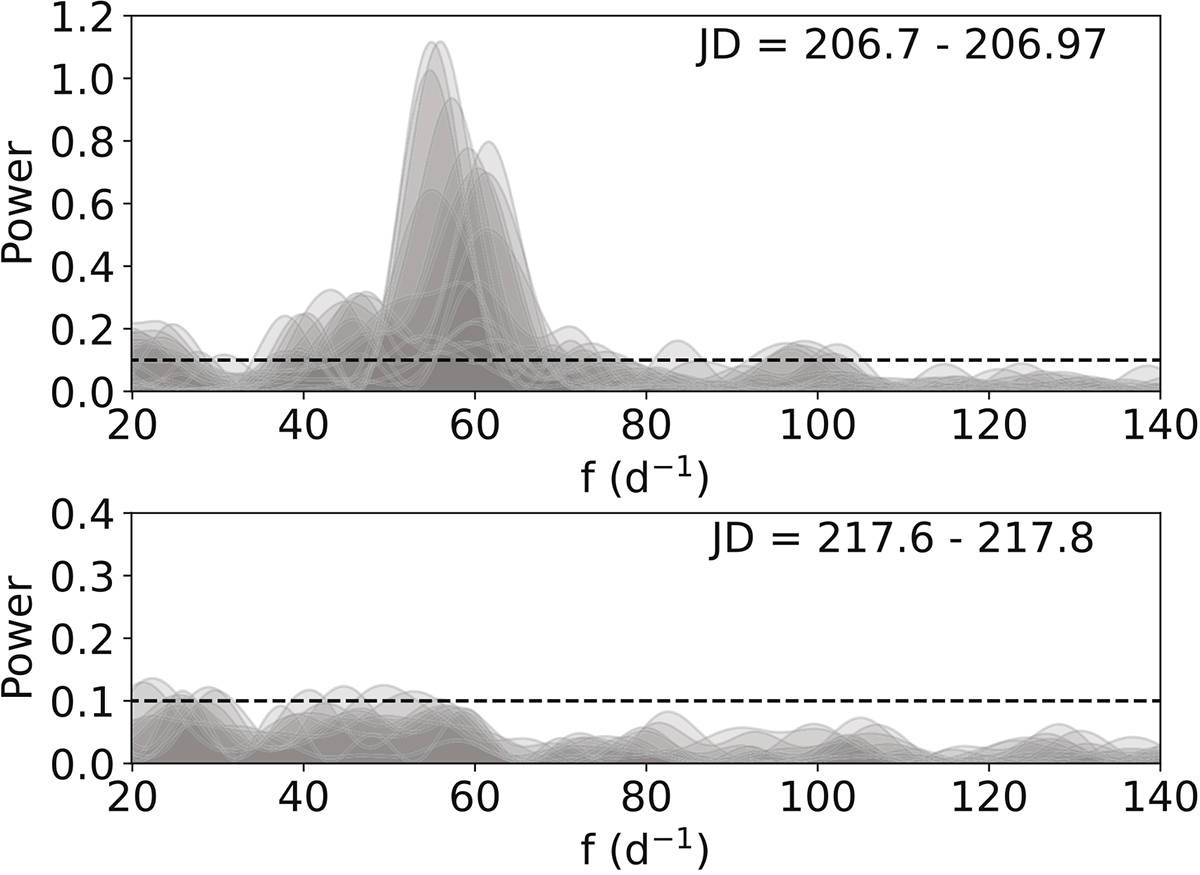
Fig. 2.
Download original image
Power spectrum of the frequency range, calculated for certain time periods. The dashed line corresponds to the power threshold of 0.1. Top panel: Period with one QPO. This corresponds to a specific frequency group visible in Fig. 3 at starting date JD 206.7. Bottom panel: Time period without QPOs, appearing as a gap in Fig. 3 around JD 217.7.
Current usage metrics show cumulative count of Article Views (full-text article views including HTML views, PDF and ePub downloads, according to the available data) and Abstracts Views on Vision4Press platform.
Data correspond to usage on the plateform after 2015. The current usage metrics is available 48-96 hours after online publication and is updated daily on week days.
Initial download of the metrics may take a while.