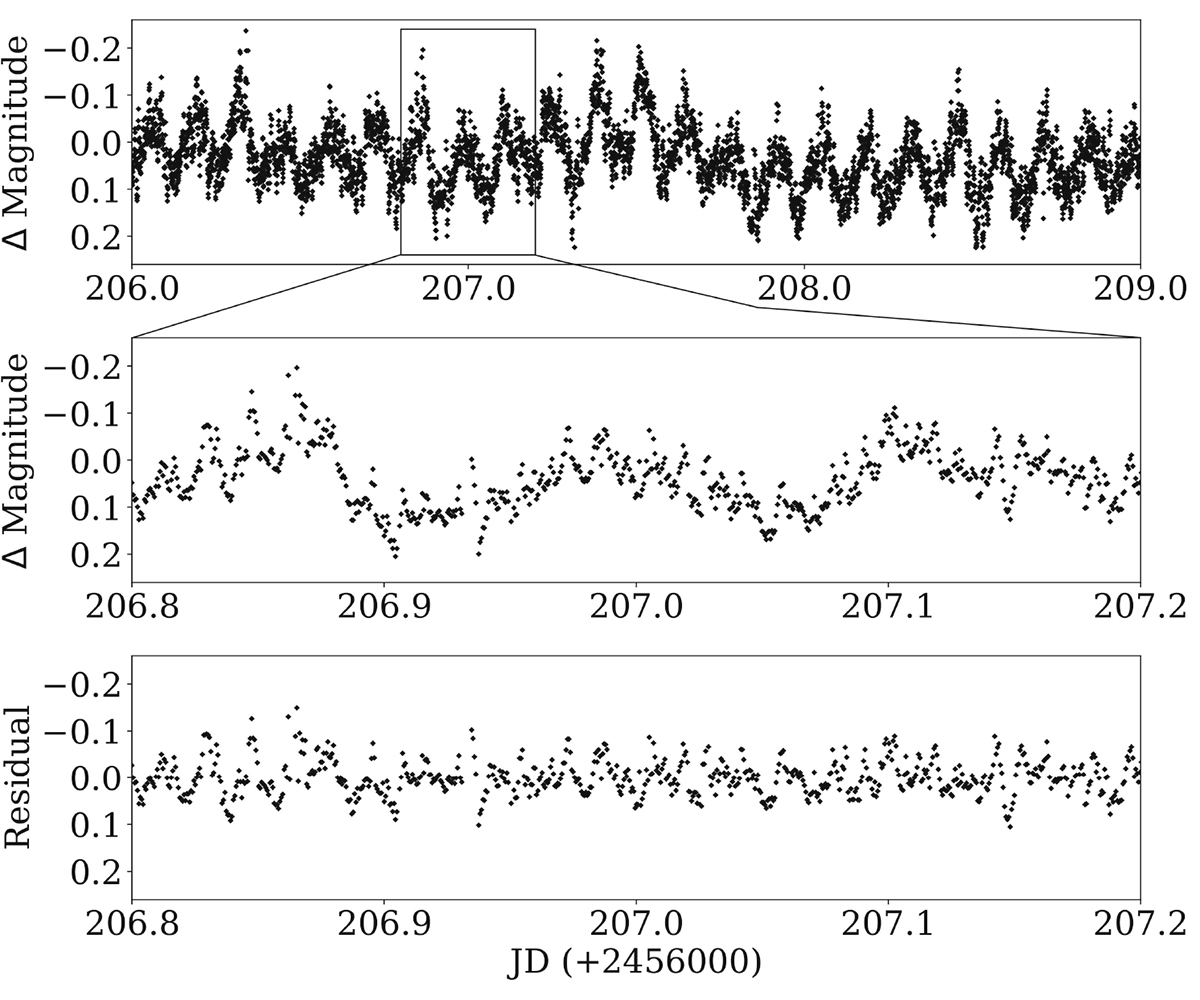
Fig. 1.
Download original image
Light-curve segment of TT Ari, showing a typical time interval in its high state. The top panel shows a three-day span from October 2012, while the middle panel shows segment of a 0.4 days (9.6 hours) within the same time interval. The bottom panel shows the residual data from the spline interpolation. Removing the superhump modulation reveals other brightness variations, including QPOs.
Current usage metrics show cumulative count of Article Views (full-text article views including HTML views, PDF and ePub downloads, according to the available data) and Abstracts Views on Vision4Press platform.
Data correspond to usage on the plateform after 2015. The current usage metrics is available 48-96 hours after online publication and is updated daily on week days.
Initial download of the metrics may take a while.