Fig. 7
Download original image
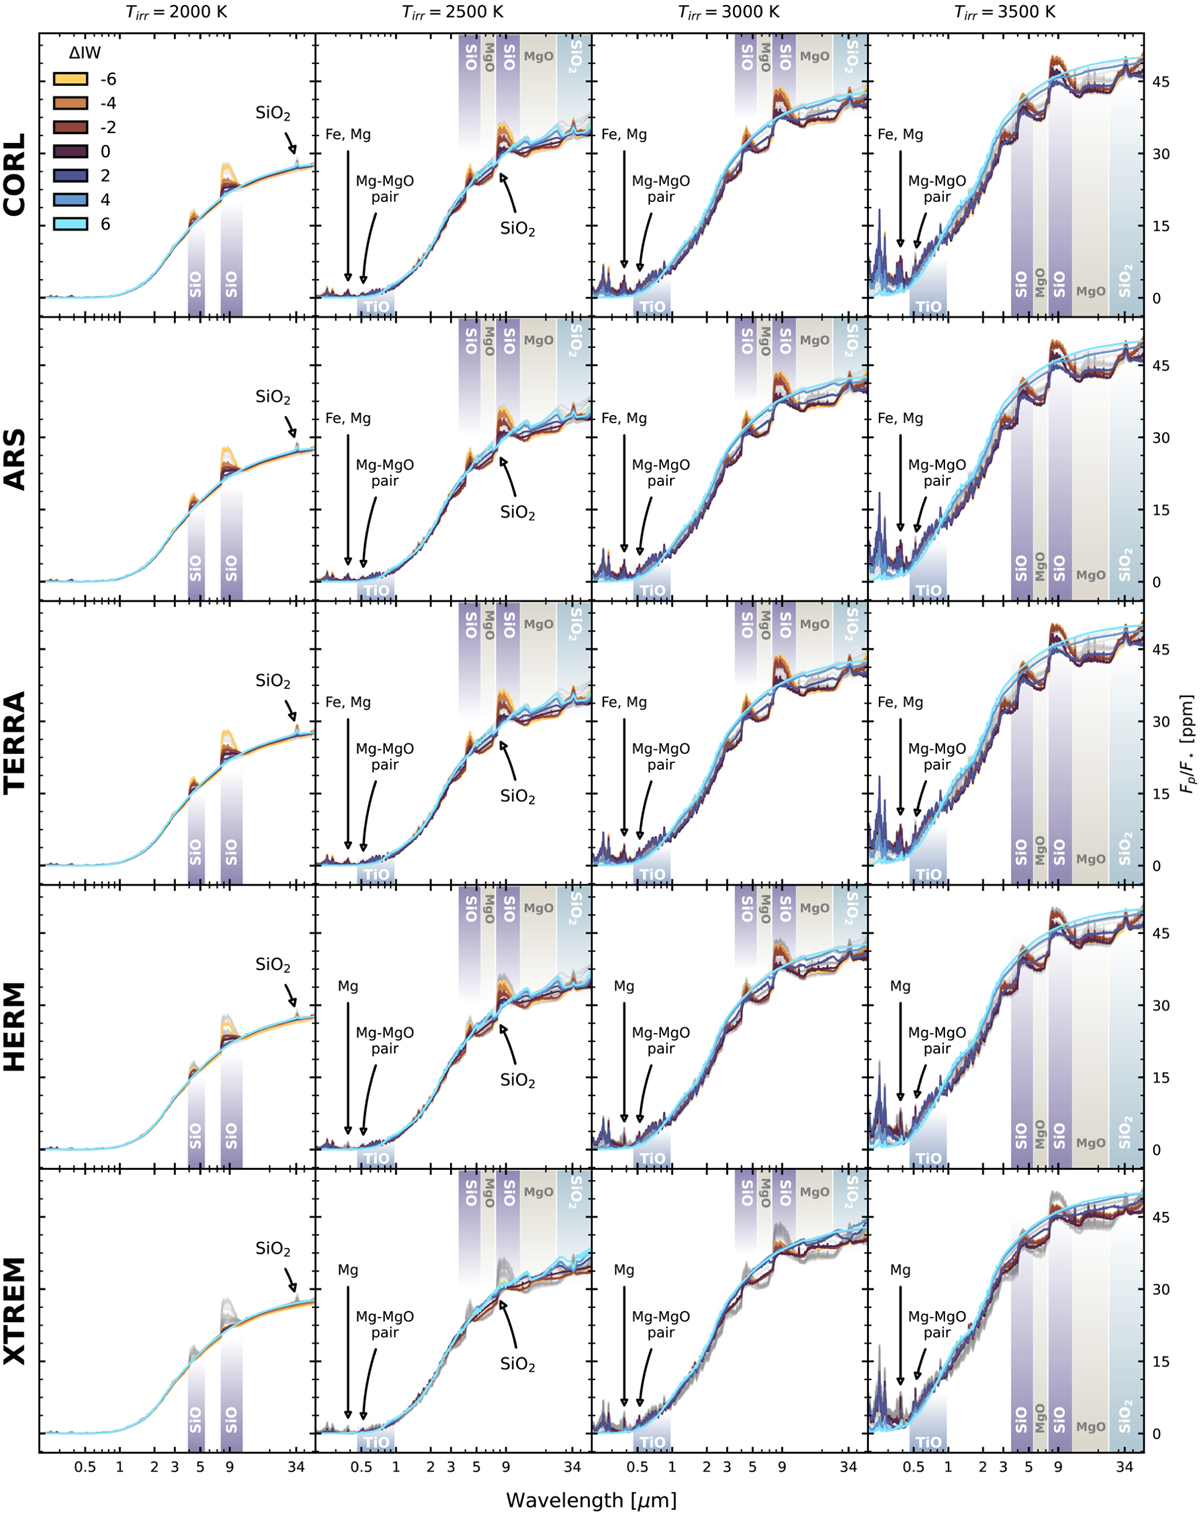
Spectra of all 140 simulations of this study. Each column contains all spectra of equal irradiation temperature, and each row constant composition. In each box, all spectra of constant irradiation temperature are plotted (grey), but only the ones corresponding to the composition indicated in the row are coloured. The colour-coding is made according to their oxygen fugacity (yellow most reducing, brown intermediate, light blue most oxidising). Species responsible for important spectral features are indicated by the pointers, important wavebands by coloured patches.
Current usage metrics show cumulative count of Article Views (full-text article views including HTML views, PDF and ePub downloads, according to the available data) and Abstracts Views on Vision4Press platform.
Data correspond to usage on the plateform after 2015. The current usage metrics is available 48-96 hours after online publication and is updated daily on week days.
Initial download of the metrics may take a while.