Fig. 6
Download original image
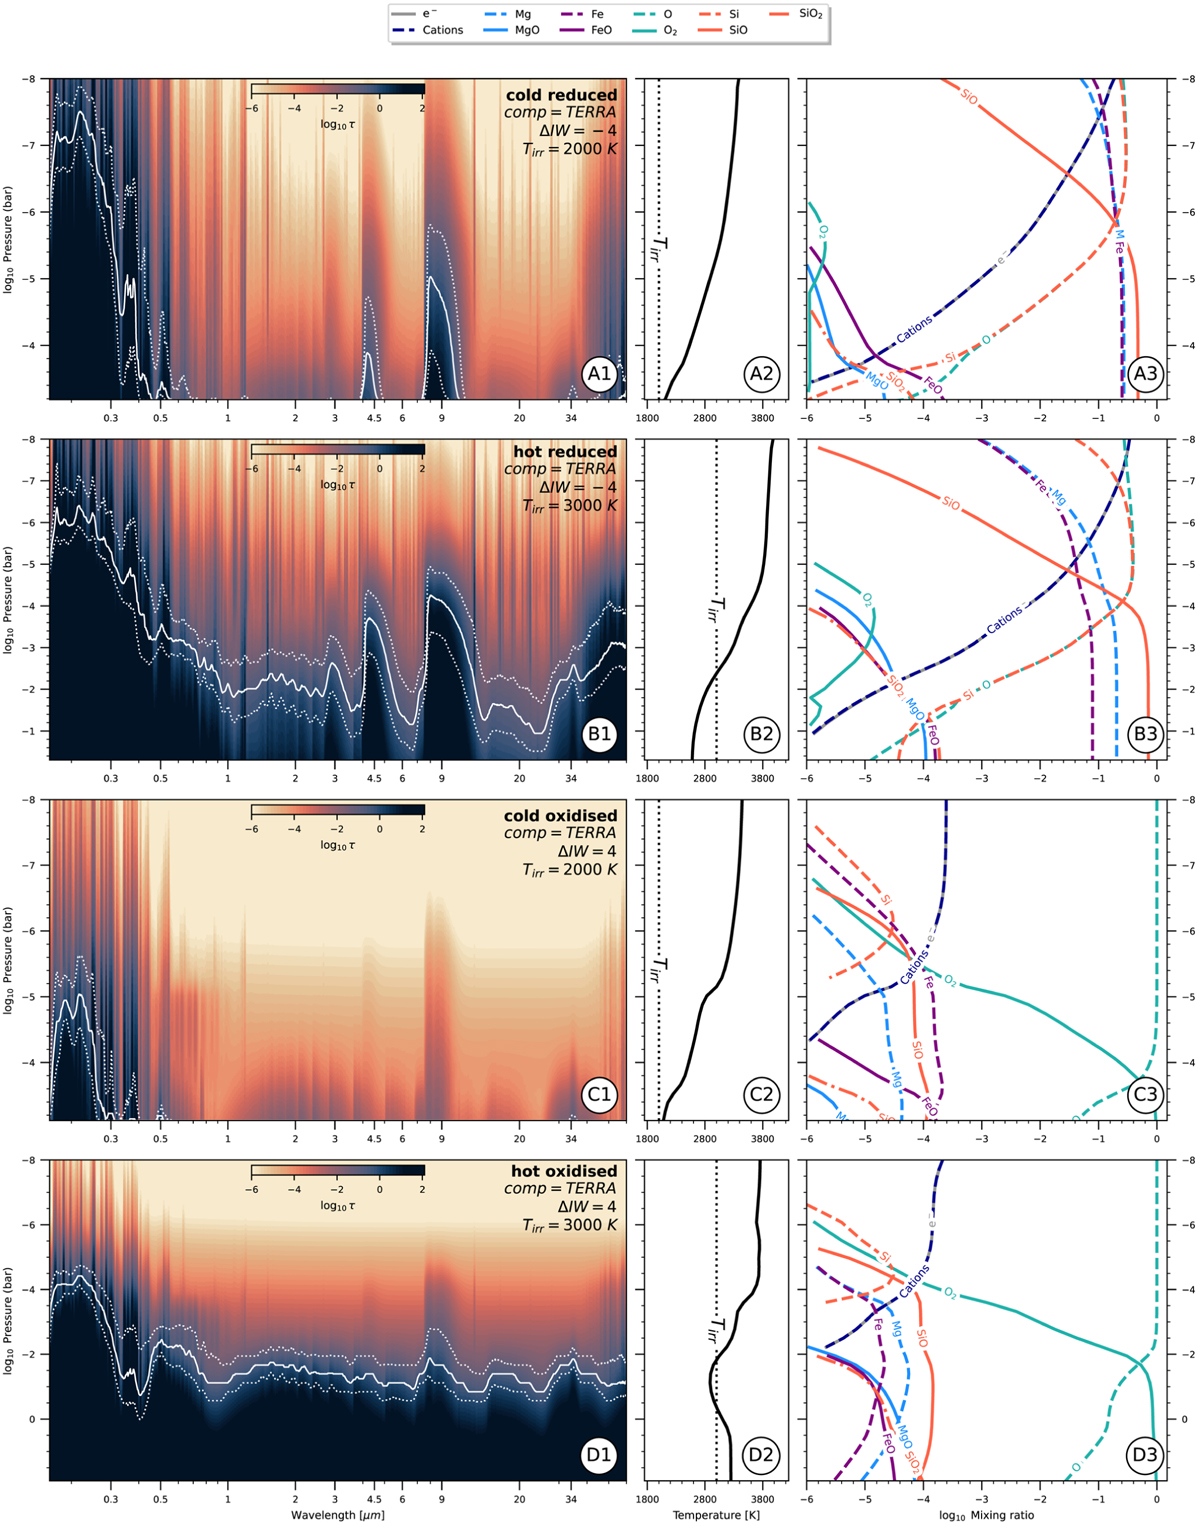
Atmospheric structure of representative combinations of ΔIW and Tirr, selected from Figs. 5A–D. The left column displays the optical depth in every atmospheric layer (color gradient), as well as an indication of the photospere (white). The latter is defined where the atmosphere has absorbed 16% (upper dotted), 50% (solid) and 84% (lower dotted) of all incoming light. The center displays the atmospheric pressure–temperature profile, with the irradiation temperature Tirr highlighted as vertical dotted line. On the right, the (volume) mixing ratios of major chemical species are shown.
Current usage metrics show cumulative count of Article Views (full-text article views including HTML views, PDF and ePub downloads, according to the available data) and Abstracts Views on Vision4Press platform.
Data correspond to usage on the plateform after 2015. The current usage metrics is available 48-96 hours after online publication and is updated daily on week days.
Initial download of the metrics may take a while.