Fig. 5
Download original image
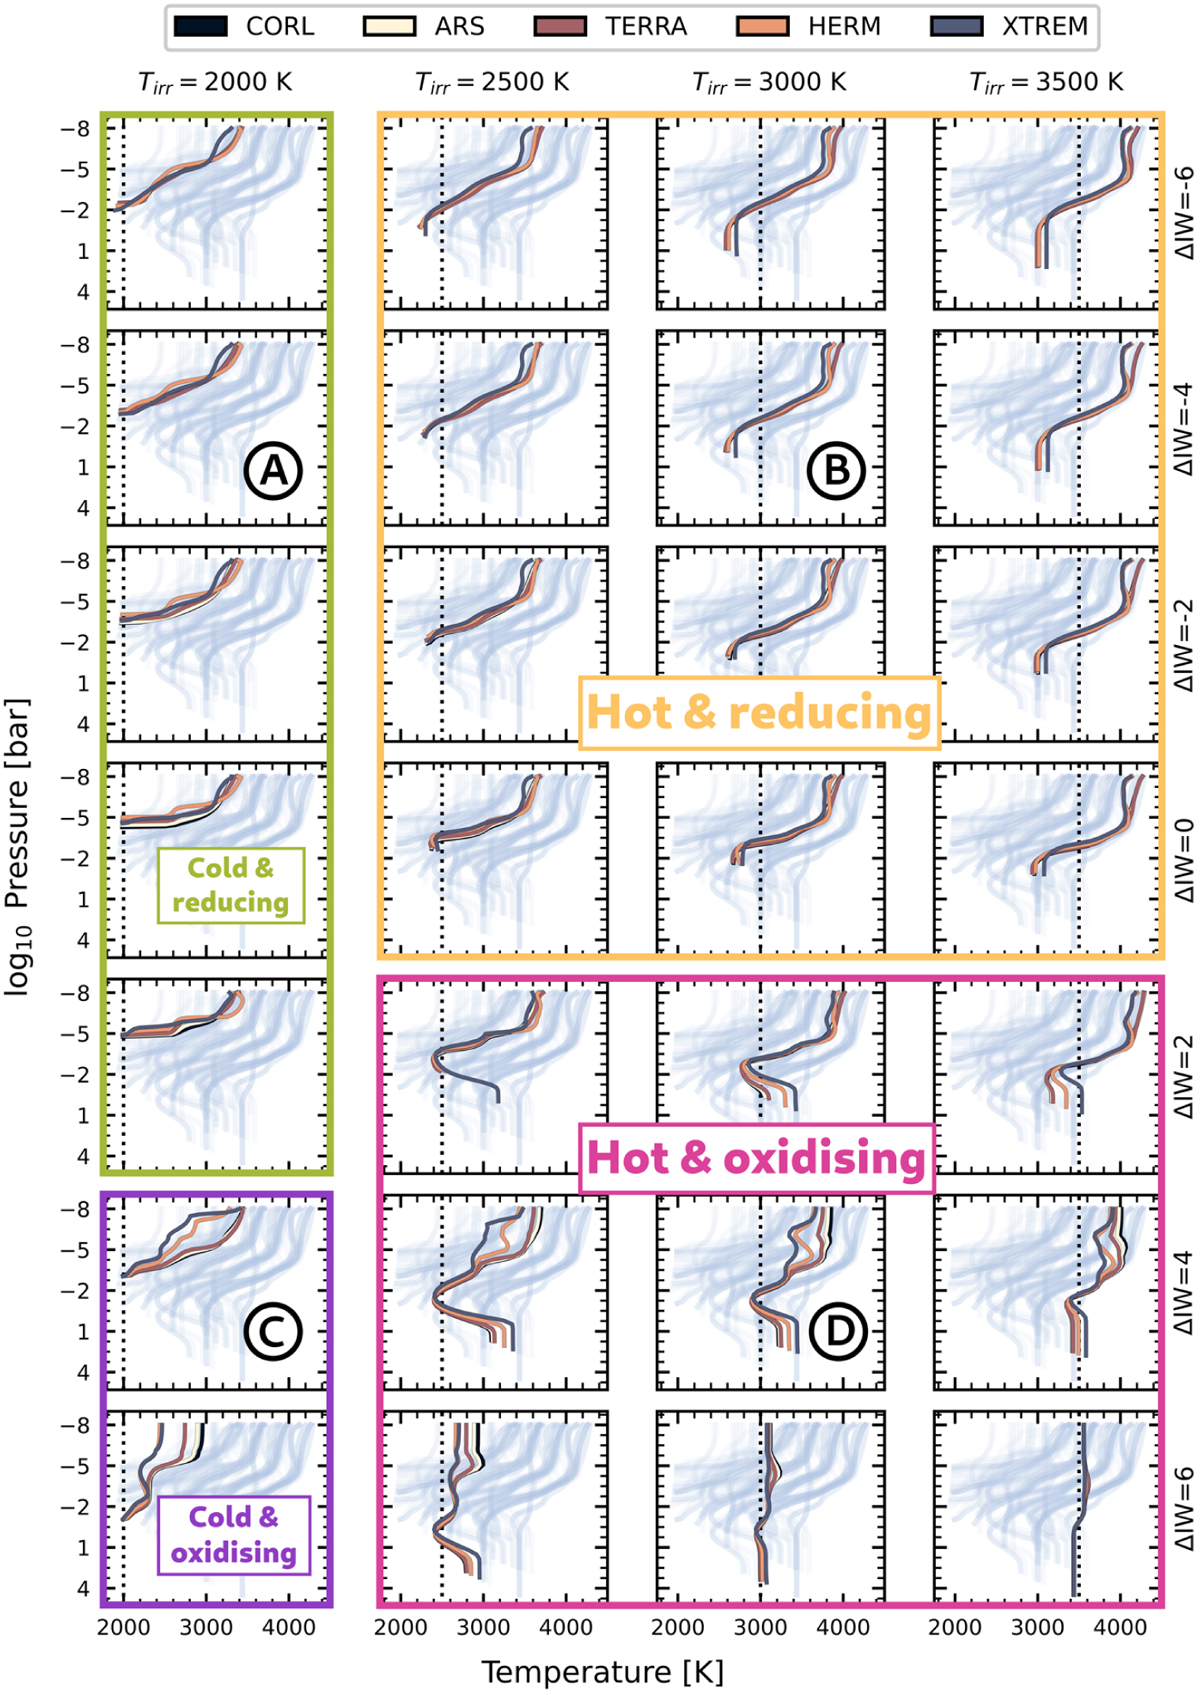
Temperature–pressure profiles of all simulated atmospheres. Each subfigure contains all spectra (light grey), with the ones corresponding to the Tirr/ΔIW of the given row and column being highlighted. Color corresponds to composition (Table 2). The black dotted, vertical lines denote the irradiation temperature of the planet. Points A–D refer to a selected set of atmospheres that are shown in more detail in Fig. 6.
Current usage metrics show cumulative count of Article Views (full-text article views including HTML views, PDF and ePub downloads, according to the available data) and Abstracts Views on Vision4Press platform.
Data correspond to usage on the plateform after 2015. The current usage metrics is available 48-96 hours after online publication and is updated daily on week days.
Initial download of the metrics may take a while.