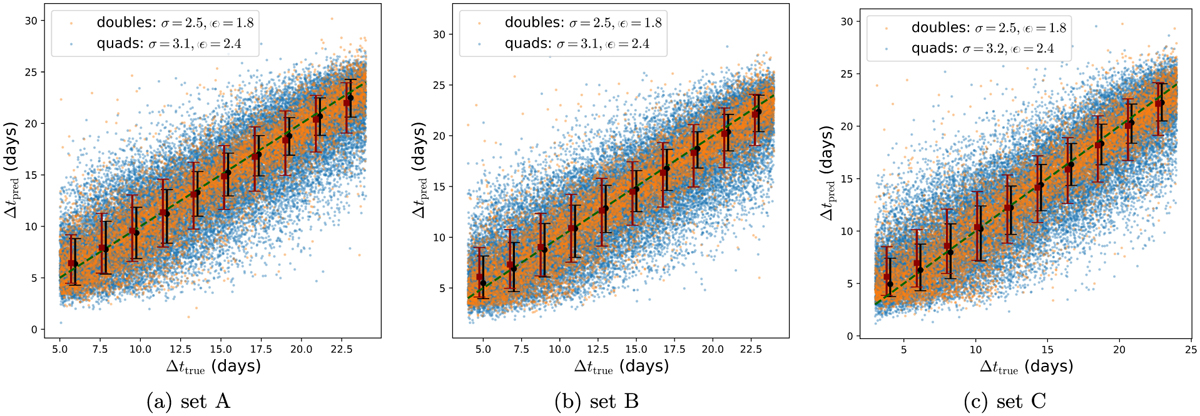
Fig. 7
Download original image
Time-delay estimates from blended joint light curves compared with truths for sets A, B, and C. All predictions come from the model trained on set D – which covers a larger ∆t range ([0.5, 30] days) – in order to minimise apparent bias at ∆t boundaries. Orange and blue dots in the plots represent individual predictions for double and quad systems, respectively. The standard deviation of residuals (σ) and the mean of their absolute values (⟨ϵ⟩) are quoted in each plot separately for doubles and quads. Samples are split into ten bins, and the 68% CL around the median is shown by error bars, again separately for doubles (black) and quads (red); the two kinds of error bars are plotted with a slight offset along the x-axis for better visualisation. It is evident that time-delay predictions are more accurate for doubles compared to quads, and, as expected, for higher time delays.
Current usage metrics show cumulative count of Article Views (full-text article views including HTML views, PDF and ePub downloads, according to the available data) and Abstracts Views on Vision4Press platform.
Data correspond to usage on the plateform after 2015. The current usage metrics is available 48-96 hours after online publication and is updated daily on week days.
Initial download of the metrics may take a while.