Open Access
Fig. 6
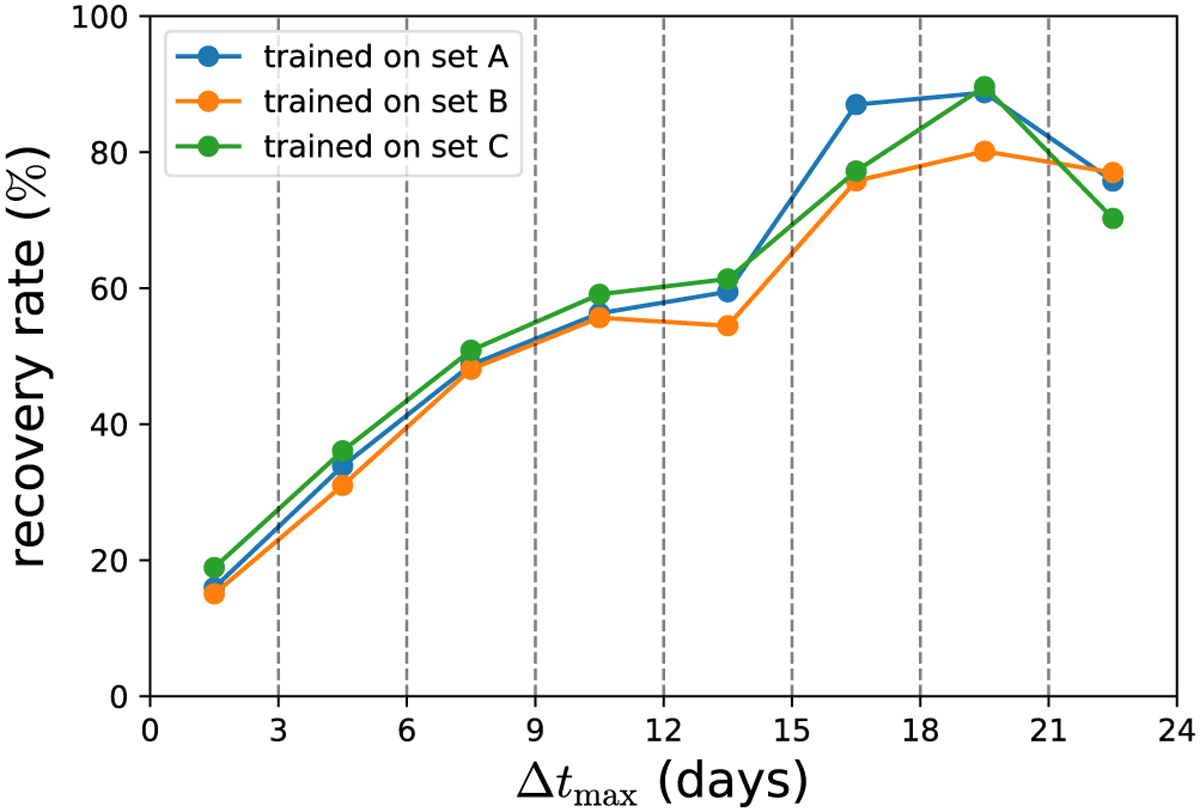
Download original image
Recovery rate for the unresolved systems in set LSST – which have good multi-band light curves available – divided into eight timedelay bins. Three colours – blue, orange, and green – represent the results obtained using the model trained on the control sets A, B, and C, respectively.
Current usage metrics show cumulative count of Article Views (full-text article views including HTML views, PDF and ePub downloads, according to the available data) and Abstracts Views on Vision4Press platform.
Data correspond to usage on the plateform after 2015. The current usage metrics is available 48-96 hours after online publication and is updated daily on week days.
Initial download of the metrics may take a while.