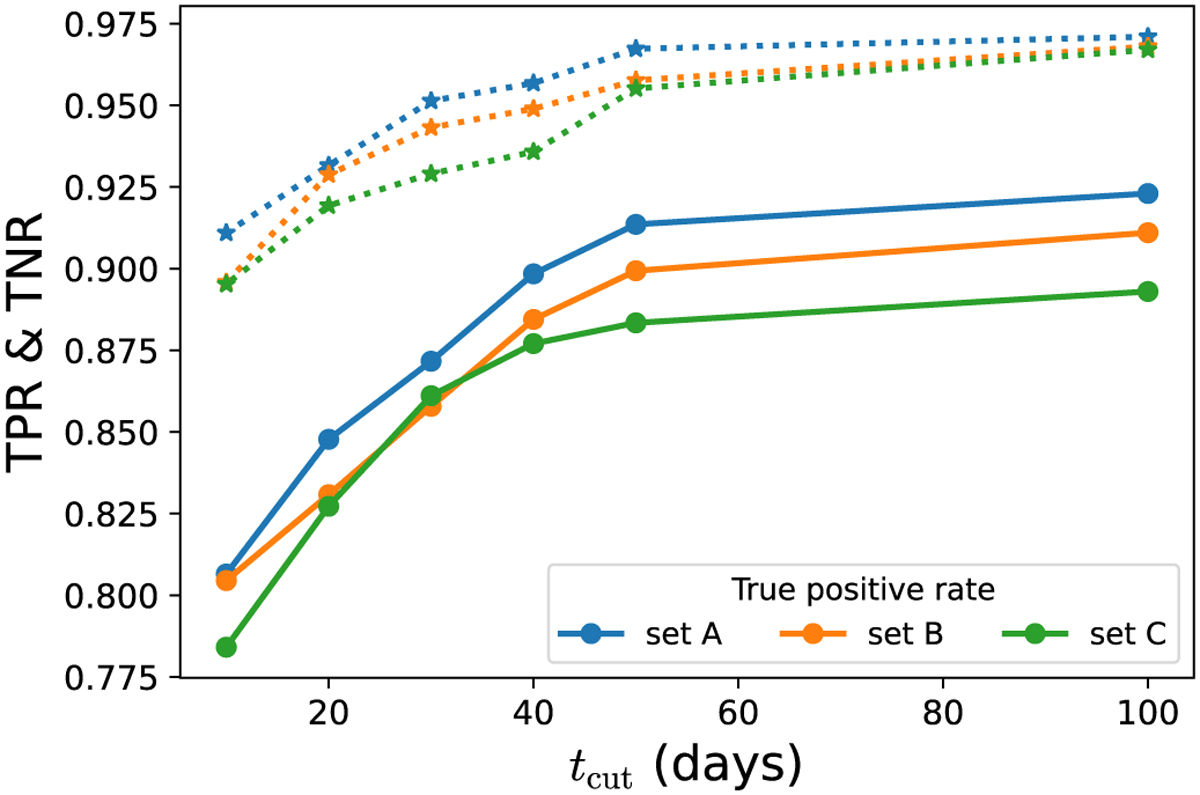
Fig. 5
Download original image
Classification results for the light curves truncated at different tcut values. True-positive rates (TPR; solid curves) and true-negative rates (TNR=l-FPR; dotted curves) are plotted for four different choices of tcut (note that the far-right points corresponds to the results already described in Section 5.1 and Tables 4–6). The results for sets A, B, and C are shown with blue, orange, and green colours, respectively. As we truncate the light curves at lower epochs, both TPR and TNR decrease, and therefore FPR increases.
Current usage metrics show cumulative count of Article Views (full-text article views including HTML views, PDF and ePub downloads, according to the available data) and Abstracts Views on Vision4Press platform.
Data correspond to usage on the plateform after 2015. The current usage metrics is available 48-96 hours after online publication and is updated daily on week days.
Initial download of the metrics may take a while.