Fig. 3
Download original image
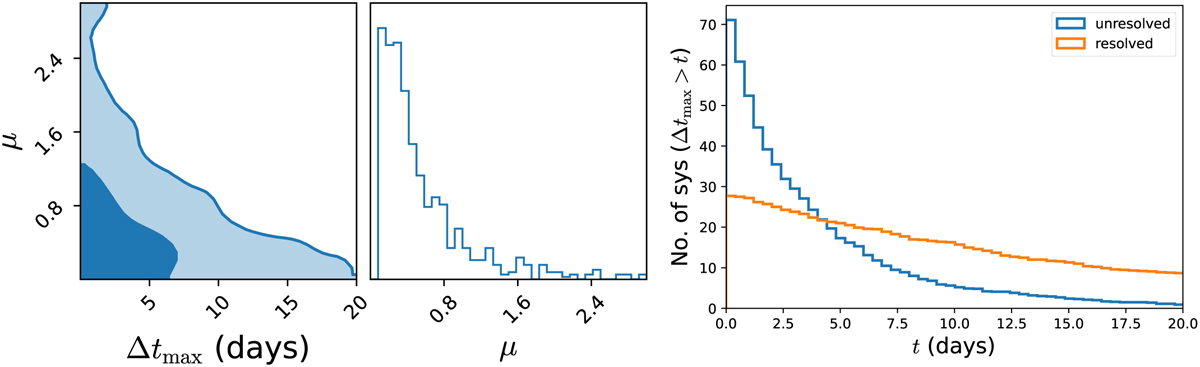
Distribution of the largest time delay (Δtmax) and the corresponding magnification ratio in all the unresolved systems is shown in the left panel; the lighter and darker shades of blue show the 68 and 95% credible regions, respectively. The middle panel presents the 1D marginalised distribution of the magnification ratio. The right panel shows the cumulative distribution of Δtmax, i.e. indicating the number of systems (in one cumulative year) that have Δtmax higher than a given value – resolved (orange) vs. unresolved (blue). It is evident that unresolved systems typically exhibit low time delays, with a median value of Δtmax of ~2.03 days and approximately 10% having values above 10 days.
Current usage metrics show cumulative count of Article Views (full-text article views including HTML views, PDF and ePub downloads, according to the available data) and Abstracts Views on Vision4Press platform.
Data correspond to usage on the plateform after 2015. The current usage metrics is available 48-96 hours after online publication and is updated daily on week days.
Initial download of the metrics may take a while.