Fig. 2
Download original image
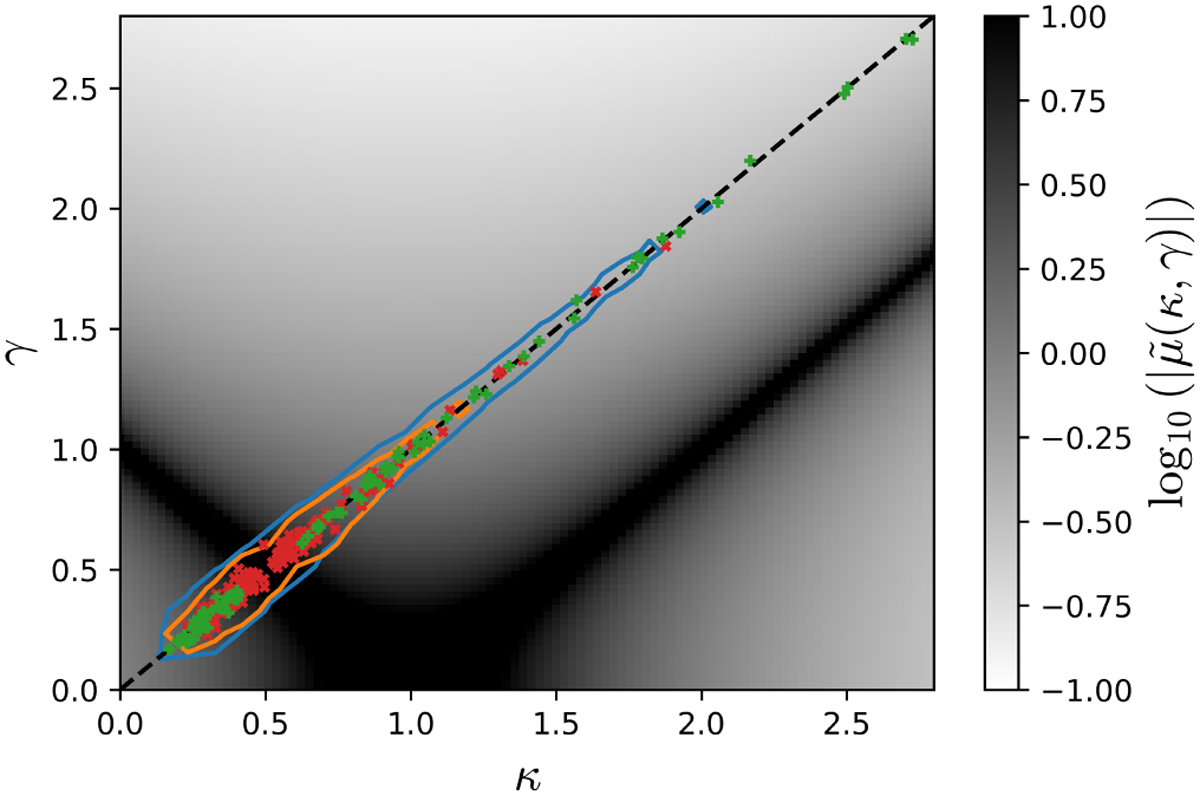
The 95% confidence level of the (κ, γ) distribution compared for the images of resolved systems (orange contour) and unresolved systems (blue contour). The greyscale represents the macro-magnification in log-scale, clipped between [0.1,10]. Notably, the (κ, γ) distribution for the unresolved systems extends towards higher values (compared to that of the resolved systems), accommodating lower magnifications. The crosses mark the (κ, γ) values of the images used to simulate the microlensed light curves, with green and red crosses distinguishing images in doubles and quads, respectively. The diagonal dashed line denotes the κ = γ line.
Current usage metrics show cumulative count of Article Views (full-text article views including HTML views, PDF and ePub downloads, according to the available data) and Abstracts Views on Vision4Press platform.
Data correspond to usage on the plateform after 2015. The current usage metrics is available 48-96 hours after online publication and is updated daily on week days.
Initial download of the metrics may take a while.