Fig. 1
Download original image
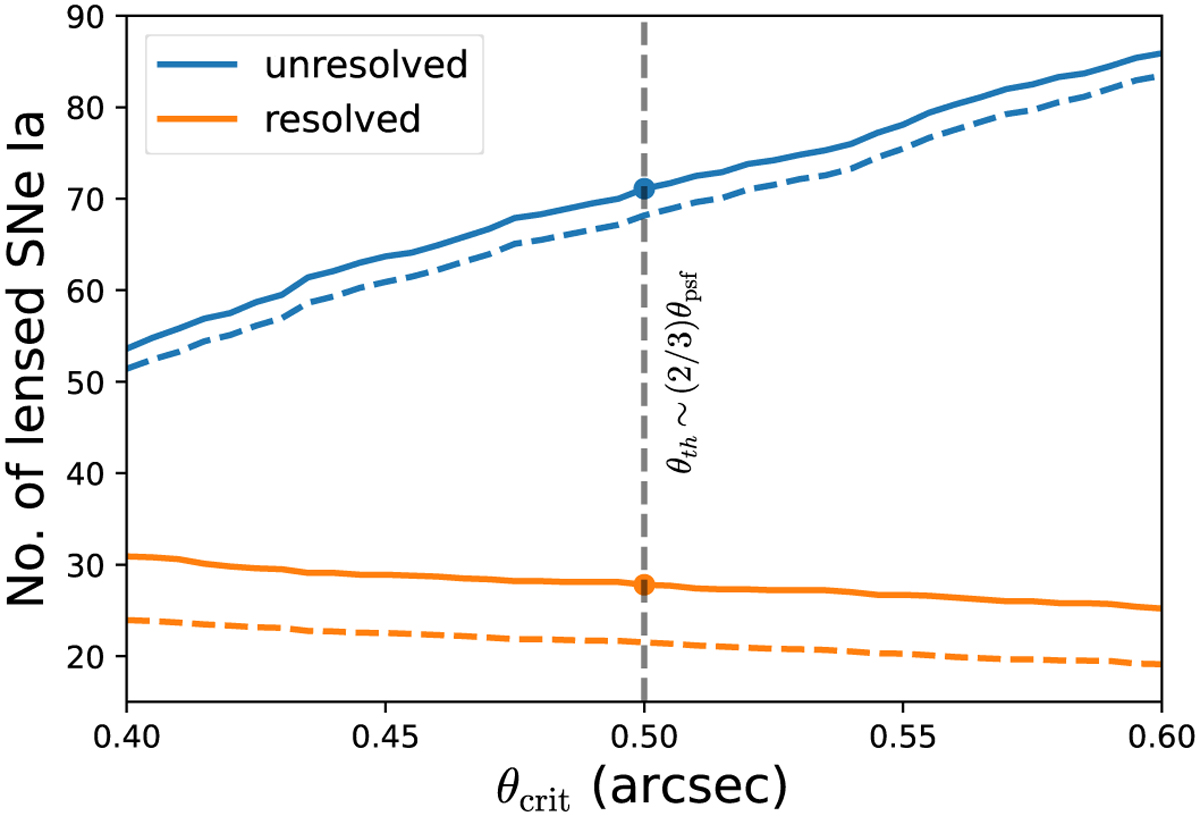
Number of unresolved LSNe Ia (blue) is compared with the number of resolved cases (orange) for one cumulative year of LSST observation at different critical angular resolution (θcrit) above which the images can be resolved. The solid curves are calculated assuming the macro-magnifications only, whereas the dashed curves consider the microlensing effects. LSST can resolve images up to θth ≈ 0.5 arcsec ~ 2/3θpsf. For this threshold, we obtain approximately 71.1 unresolved (blue dot) and 27.8 resolved (orange dot) LSNe Ia based solely on macro-magnification calculation, indicating roughly 2.6 times more unresolved systems. The ratio increases to approximately 3.2 when we account for microlensing, as evident from the dashed curves. We emphasize that these numbers correspond to one effective year of LSST observation over 20 000 deg2 in i-band. LSST will observe a sky location cumulatively for ~4 years on average during its ten-year run. Therefore, it is essential to scale these figures by a factor of ~4 to get the realistic predictions.
Current usage metrics show cumulative count of Article Views (full-text article views including HTML views, PDF and ePub downloads, according to the available data) and Abstracts Views on Vision4Press platform.
Data correspond to usage on the plateform after 2015. The current usage metrics is available 48-96 hours after online publication and is updated daily on week days.
Initial download of the metrics may take a while.