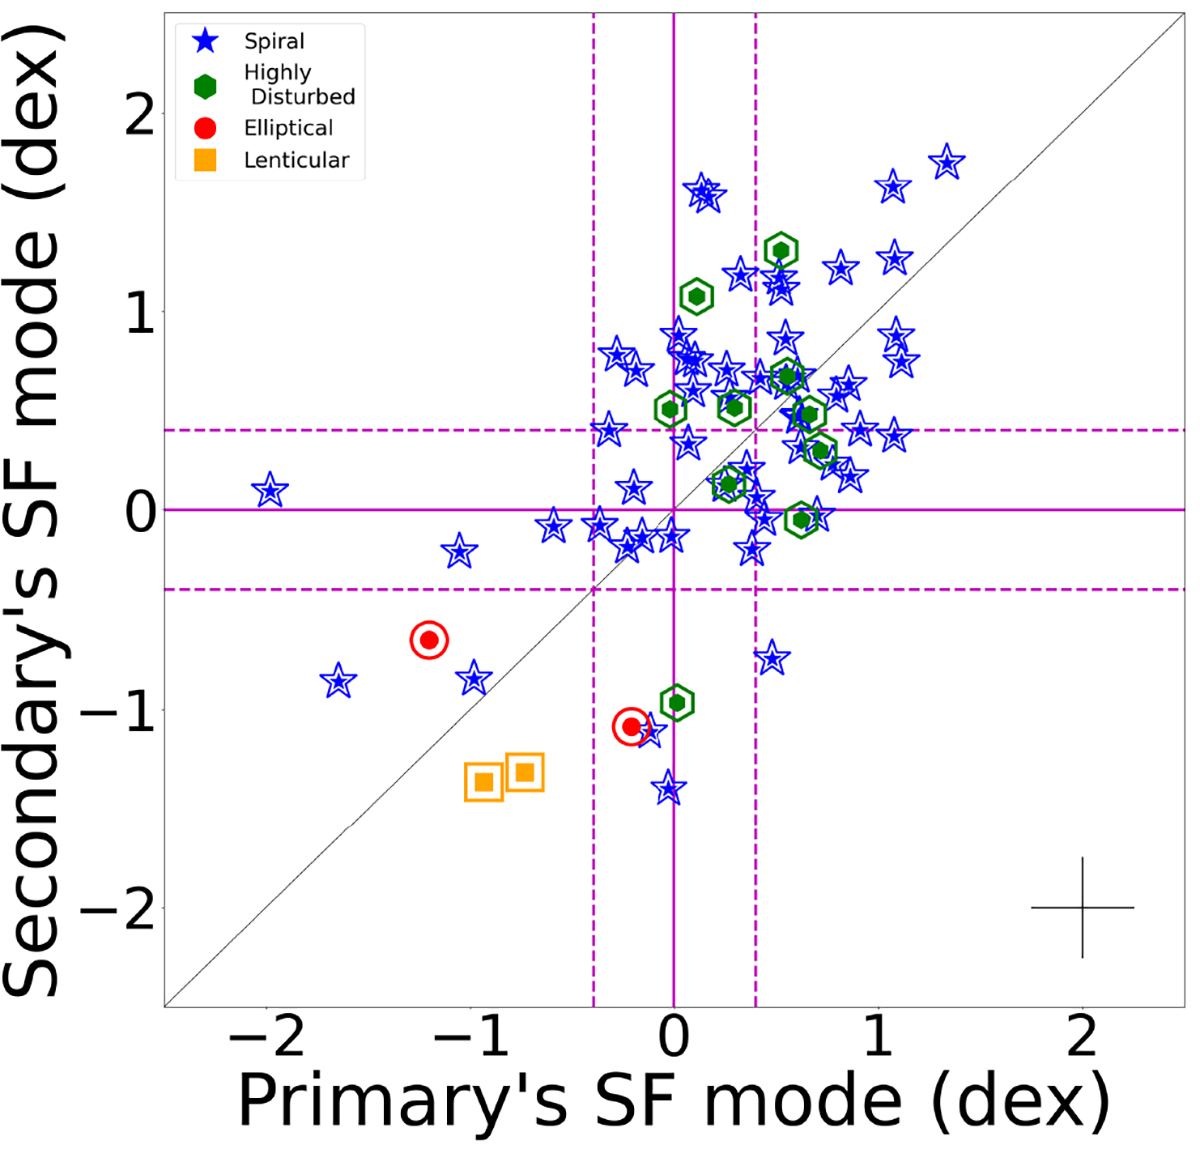
Fig. 8.
Download original image
Comparison between the SF mode of the primary and the secondary component, for mergers with components of the same morphology. The coloured symbols show the morphology of the primary (unfilled symbols) and the secondary (filled symbols) components as shown in the legend. The solid- and dashed-magenta lines represent the MS and the black line shows the one-to-one relation. The typical error is shown in the bottom-right corner.
Current usage metrics show cumulative count of Article Views (full-text article views including HTML views, PDF and ePub downloads, according to the available data) and Abstracts Views on Vision4Press platform.
Data correspond to usage on the plateform after 2015. The current usage metrics is available 48-96 hours after online publication and is updated daily on week days.
Initial download of the metrics may take a while.