Open Access
Fig. 8.
Download original image
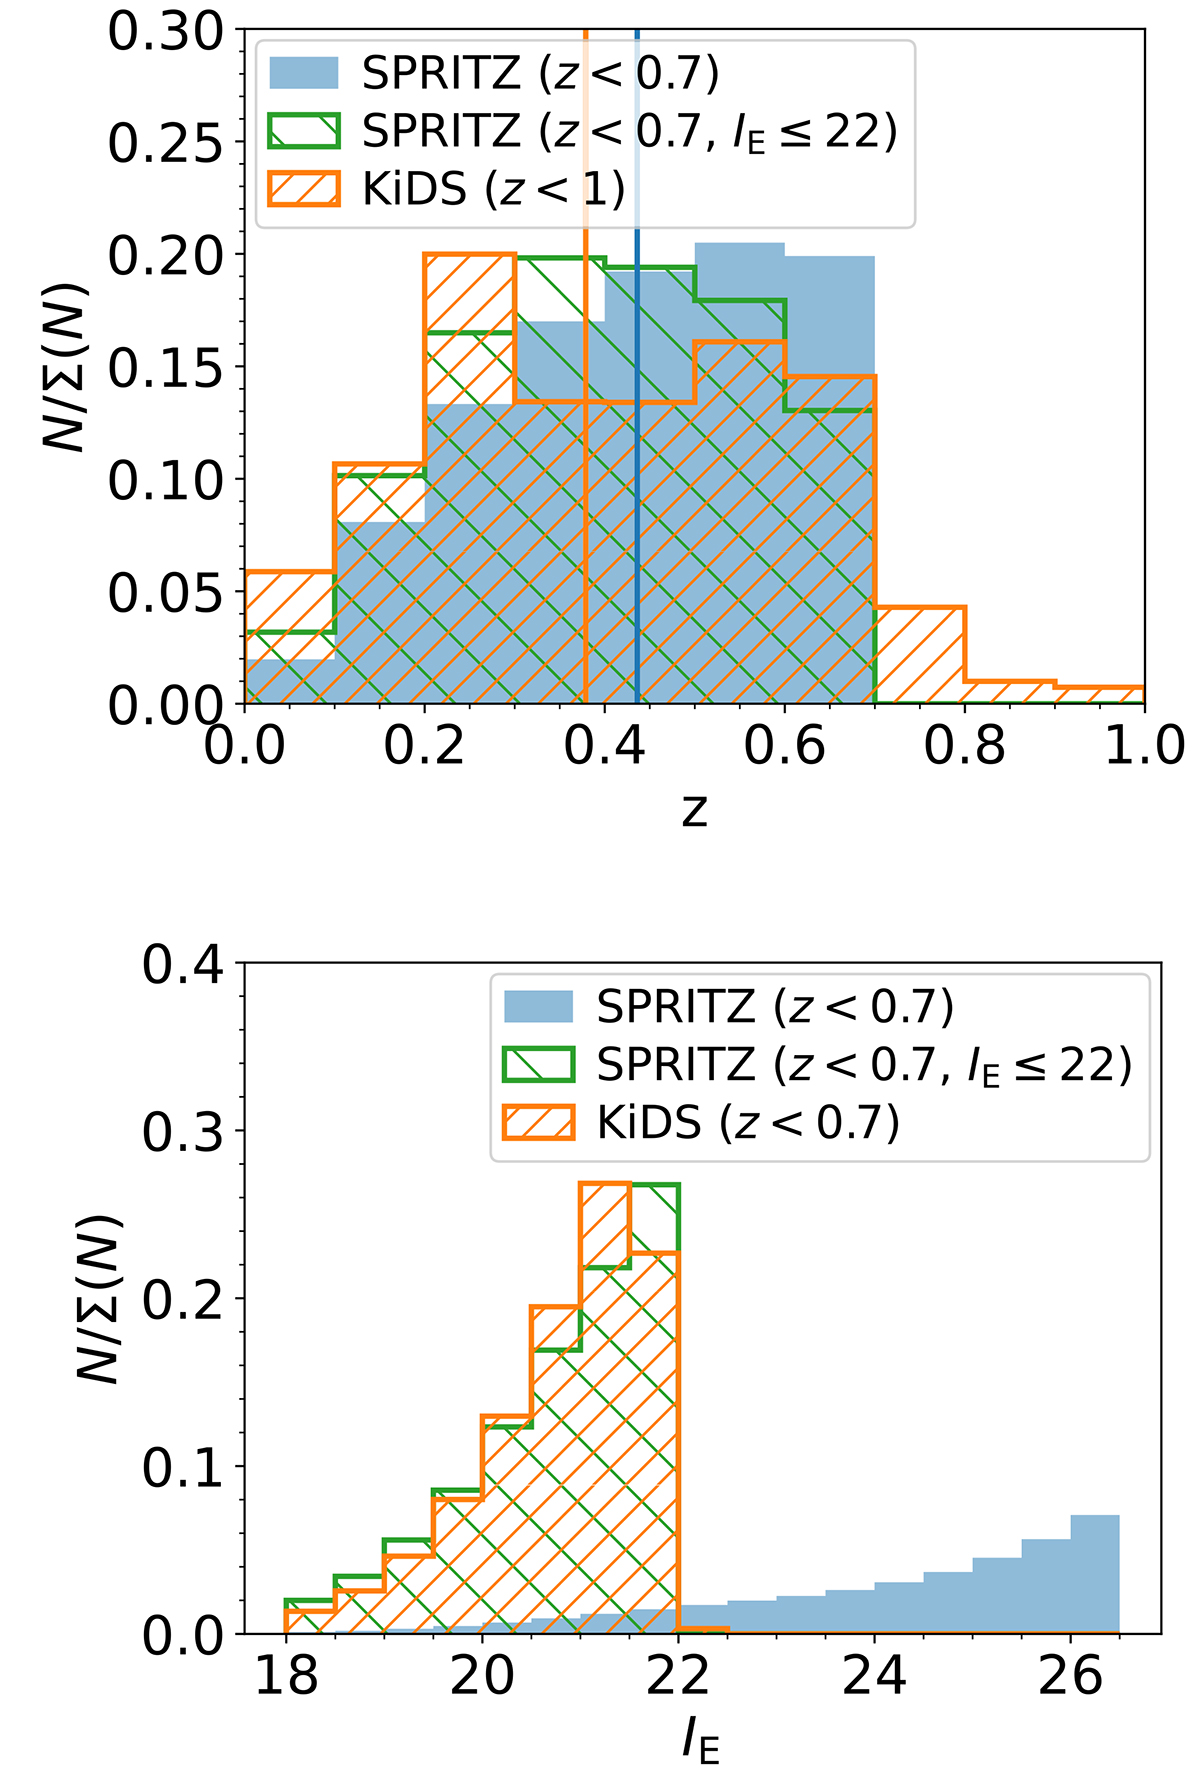
Normalised distributions of the redshift (top panel) and the IE magnitude (bottom panel) for the simulated catalogues from SPRITZ (filled blue and hatched green histograms) and KiDS (orange hatched histogram). Vertical lines in the top panel show the average redshift of the two samples at z < 0.7.
Current usage metrics show cumulative count of Article Views (full-text article views including HTML views, PDF and ePub downloads, according to the available data) and Abstracts Views on Vision4Press platform.
Data correspond to usage on the plateform after 2015. The current usage metrics is available 48-96 hours after online publication and is updated daily on week days.
Initial download of the metrics may take a while.