Fig. 7.
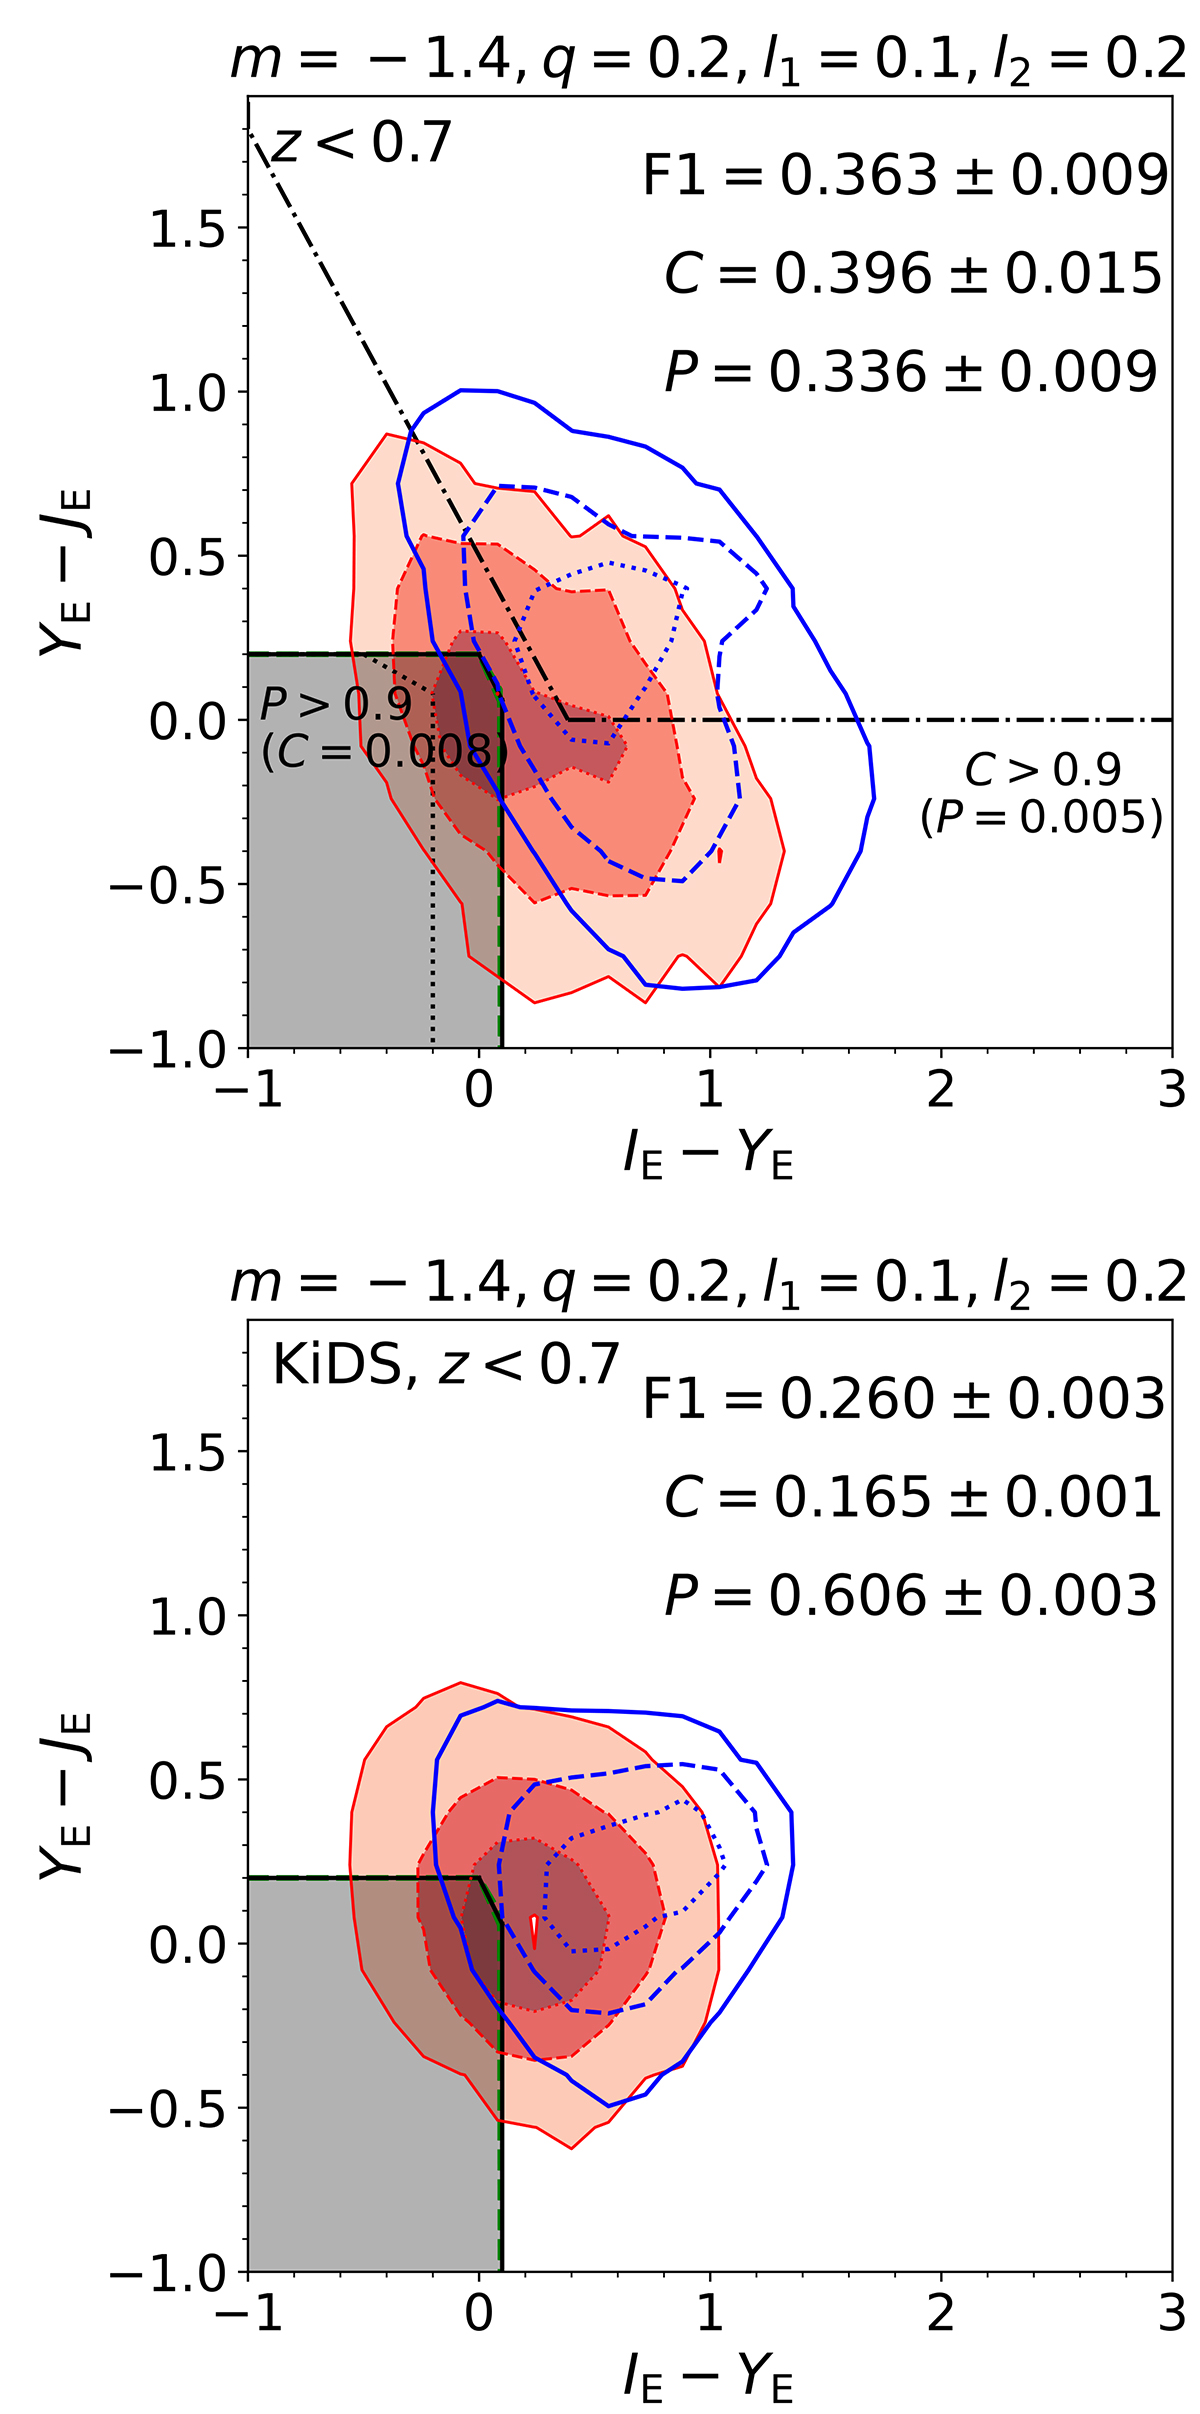
Download original image
Best selection (type A) criterion for AGN1 at z < 0.7 in SPRITZ (top panel) and KiDS (bottom panel) in the EDS using Euclid filters (shaded grey area). The shaded red areas correspond to the colour distribution of AGN1, while the blue lines are the contour levels of the remaining galaxies. Levels correspond to 68%, 95%, and 99.7% of the distribution. As an indication of how strict the best selection is, the hatched green area limited by the two dashed green lines shows the extent of all the best selection criteria derived with the bootstrap approach. The dotted black line and the dash-dotted black line correspond to the best selections, with P > 0.9 and C > 0.9, respectively.
Current usage metrics show cumulative count of Article Views (full-text article views including HTML views, PDF and ePub downloads, according to the available data) and Abstracts Views on Vision4Press platform.
Data correspond to usage on the plateform after 2015. The current usage metrics is available 48-96 hours after online publication and is updated daily on week days.
Initial download of the metrics may take a while.