Open Access
Fig. 6.
Download original image
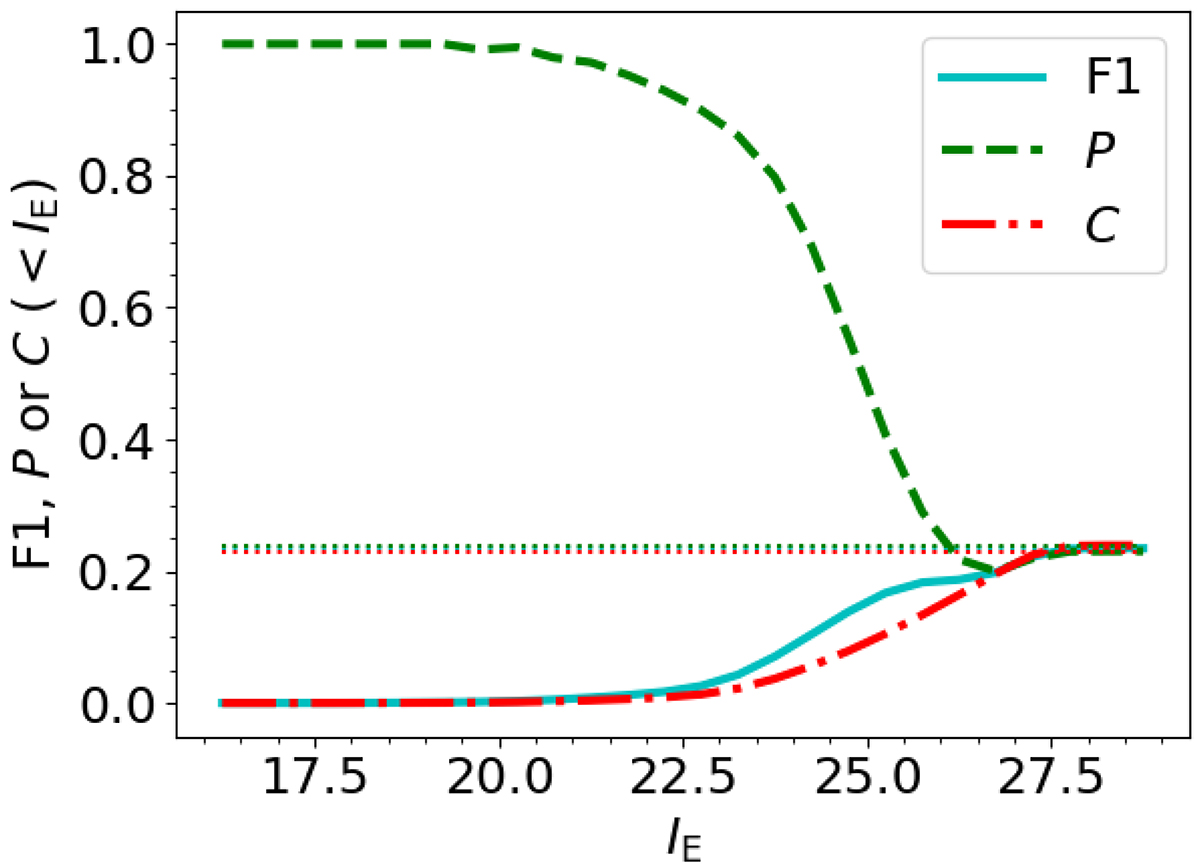
Variation of the F1 score (solid cyan line), completeness (dash-dotted red line), and purity (dashed green line) with IE magnitude limit. Horizontal dotted lines show the values using Eq. (10) without applying any additional magnitude cut.
Current usage metrics show cumulative count of Article Views (full-text article views including HTML views, PDF and ePub downloads, according to the available data) and Abstracts Views on Vision4Press platform.
Data correspond to usage on the plateform after 2015. The current usage metrics is available 48-96 hours after online publication and is updated daily on week days.
Initial download of the metrics may take a while.