Open Access
Fig. 20.
Download original image
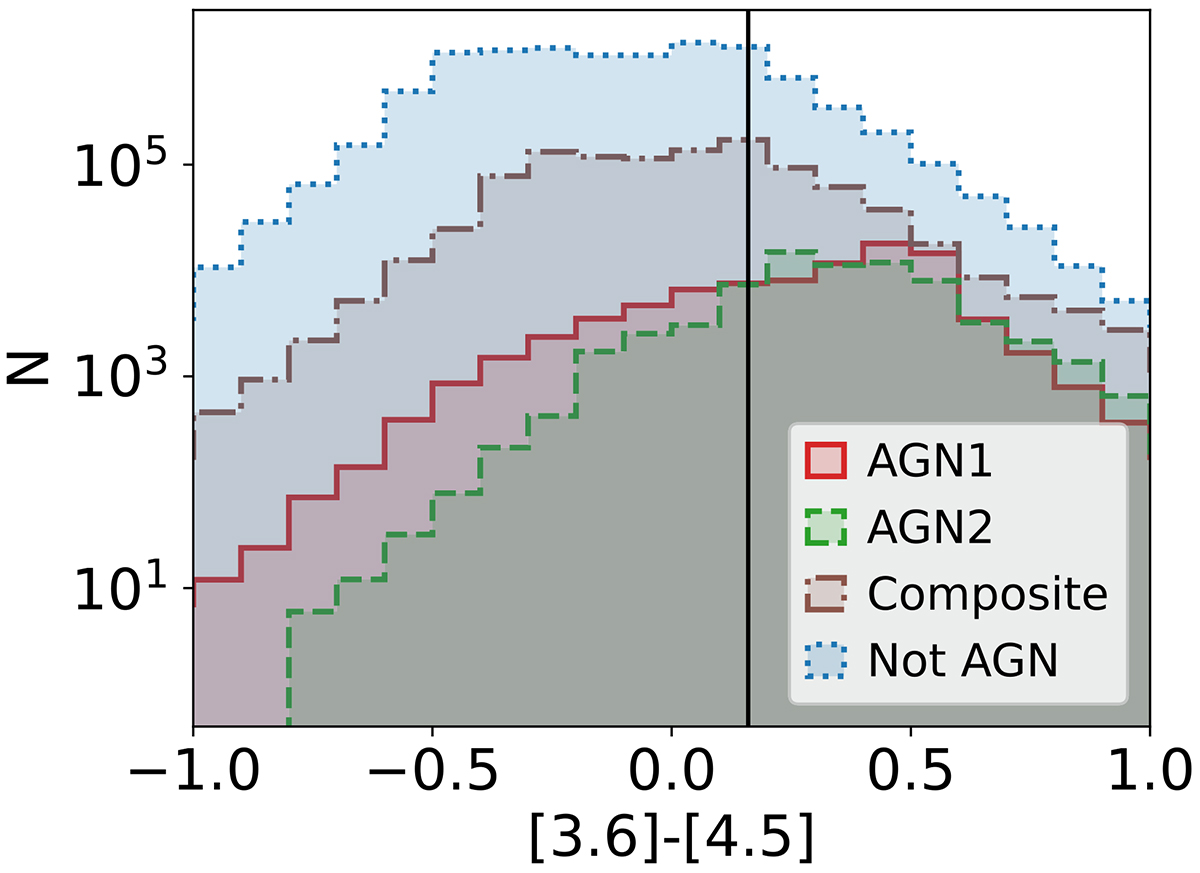
[3.6]−[4.5] colour distribution for objects in our mock catalogue in the EDF, divided by different AGN populations and objects without an AGN. We include only objects with S/N > 3 in both IRAC filters. The vertical black line corresponds to the selection ![]() (Stern et al. 2012).
(Stern et al. 2012).
Current usage metrics show cumulative count of Article Views (full-text article views including HTML views, PDF and ePub downloads, according to the available data) and Abstracts Views on Vision4Press platform.
Data correspond to usage on the plateform after 2015. The current usage metrics is available 48-96 hours after online publication and is updated daily on week days.
Initial download of the metrics may take a while.