Open Access
Fig. 2.
Download original image
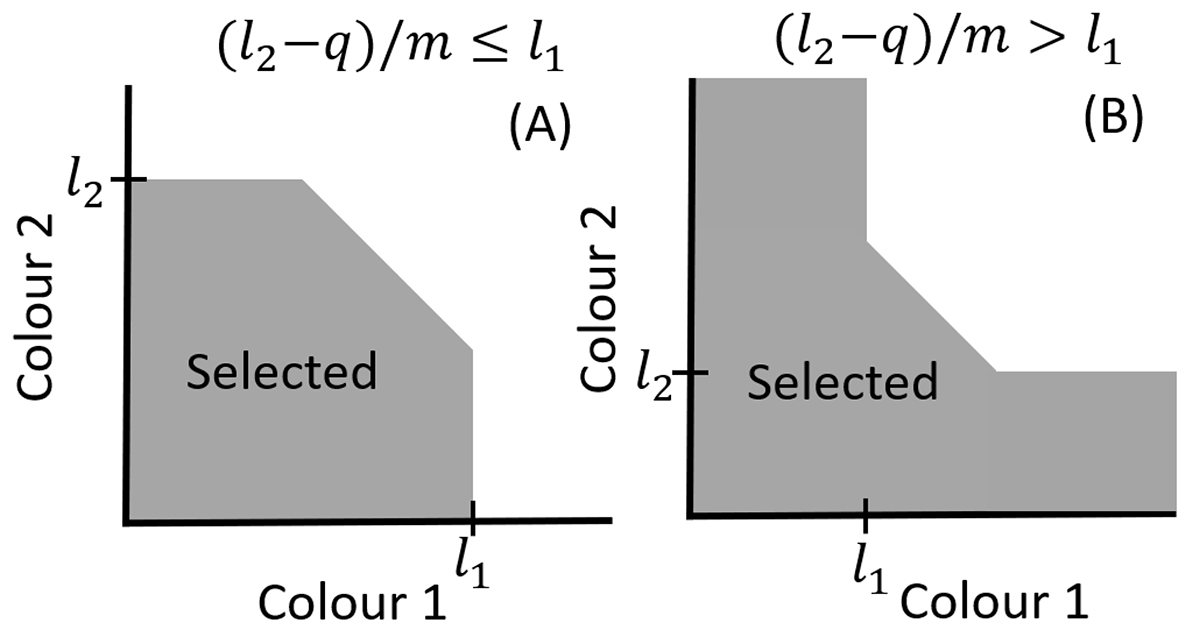
Sketch of the two selection criteria considered in this work, referred to as type A (left) and type B (right). The grey areas indicate the selected regions. The diagonal separation is defined by a line with slope m and vertical intercept q.
Current usage metrics show cumulative count of Article Views (full-text article views including HTML views, PDF and ePub downloads, according to the available data) and Abstracts Views on Vision4Press platform.
Data correspond to usage on the plateform after 2015. The current usage metrics is available 48-96 hours after online publication and is updated daily on week days.
Initial download of the metrics may take a while.