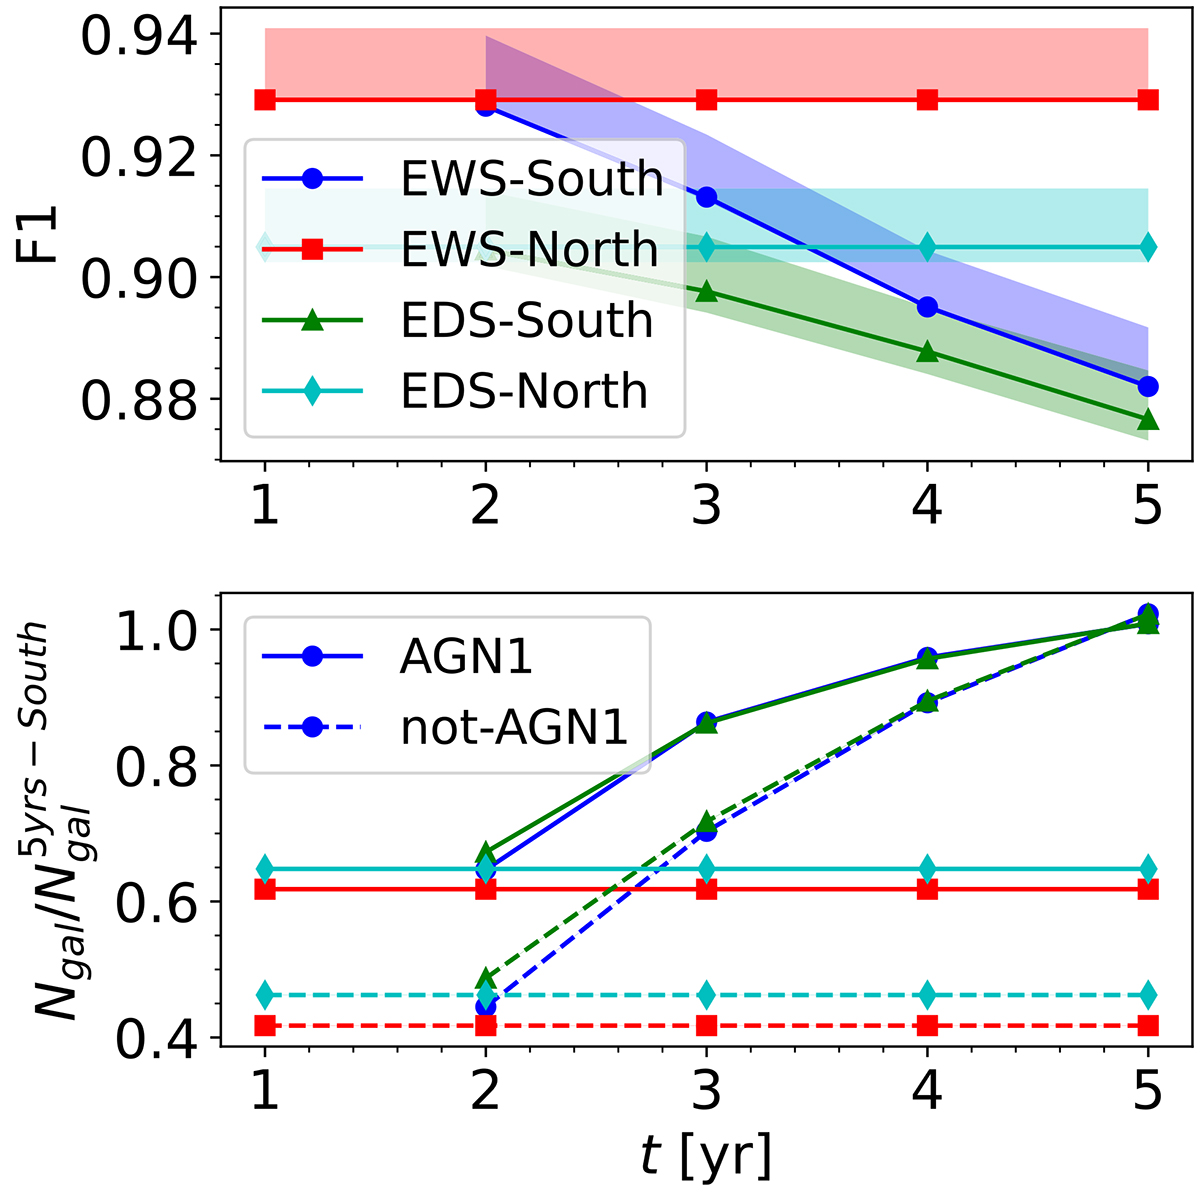
Fig. 18.
Download original image
Effects of the increasing depths of the optical ancillary data on the AGN selection. Top: variation of the F1 score with time due to the increasing depths of optical ancillary data. The depths of the ancillary data in the north remains constant with time, but we include them for comparison. The F1 score here corresponds to AGN1 derived using Euclid and Rubin/LSST filters. Bottom: variation of the number of AGN1 (solid lines) or non-AGN1 (i.e. all other AGN, SF, and passive galaxies, dashed lines) with time normalised to the number of AGN1 or non-AGN1 observed by the fifth year in the south. In the south no u-band filter observations will be available in the first year, so the analysis starts from the second year. Some of the F1 scores decrease with time because shallower u band observations correspond to smaller samples and the brightest AGN are the easiest ones to identify.
Current usage metrics show cumulative count of Article Views (full-text article views including HTML views, PDF and ePub downloads, according to the available data) and Abstracts Views on Vision4Press platform.
Data correspond to usage on the plateform after 2015. The current usage metrics is available 48-96 hours after online publication and is updated daily on week days.
Initial download of the metrics may take a while.