Fig. 10.
Download original image
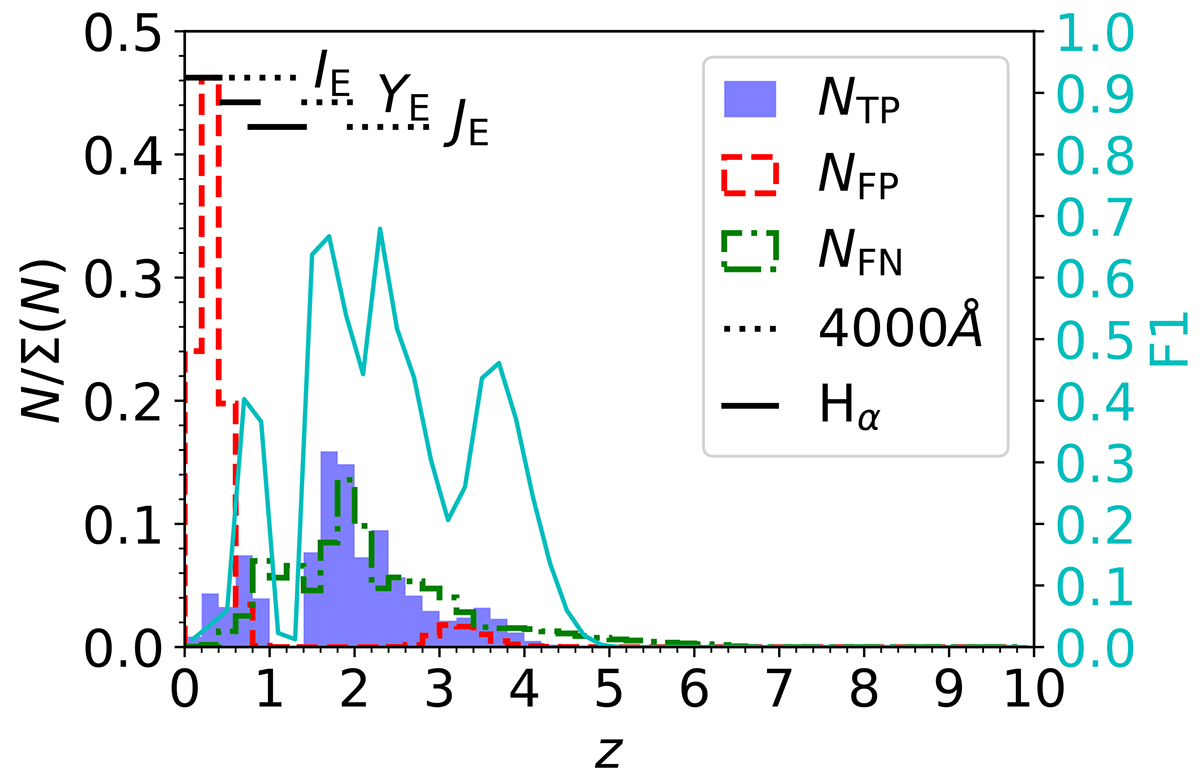
Normalised redshift distribution of the NTP (filled blue histogram), NFP (dashed red histogram), and NFN (dot-dashed green histogram) for the Euclid-only selection criteria (Eq. (11)) of AGN1 in the EWS. The horizontal solid and dotted lines show the redshift range in which Hα and the 4000 Å-break, respectively, are inside the IE, YE, or JE filters (HE is not used in Eq. (11)). We also report the variation of the F1 score with redshift (solid cyan line and right vertical axis).
Current usage metrics show cumulative count of Article Views (full-text article views including HTML views, PDF and ePub downloads, according to the available data) and Abstracts Views on Vision4Press platform.
Data correspond to usage on the plateform after 2015. The current usage metrics is available 48-96 hours after online publication and is updated daily on week days.
Initial download of the metrics may take a while.