Fig. 9.
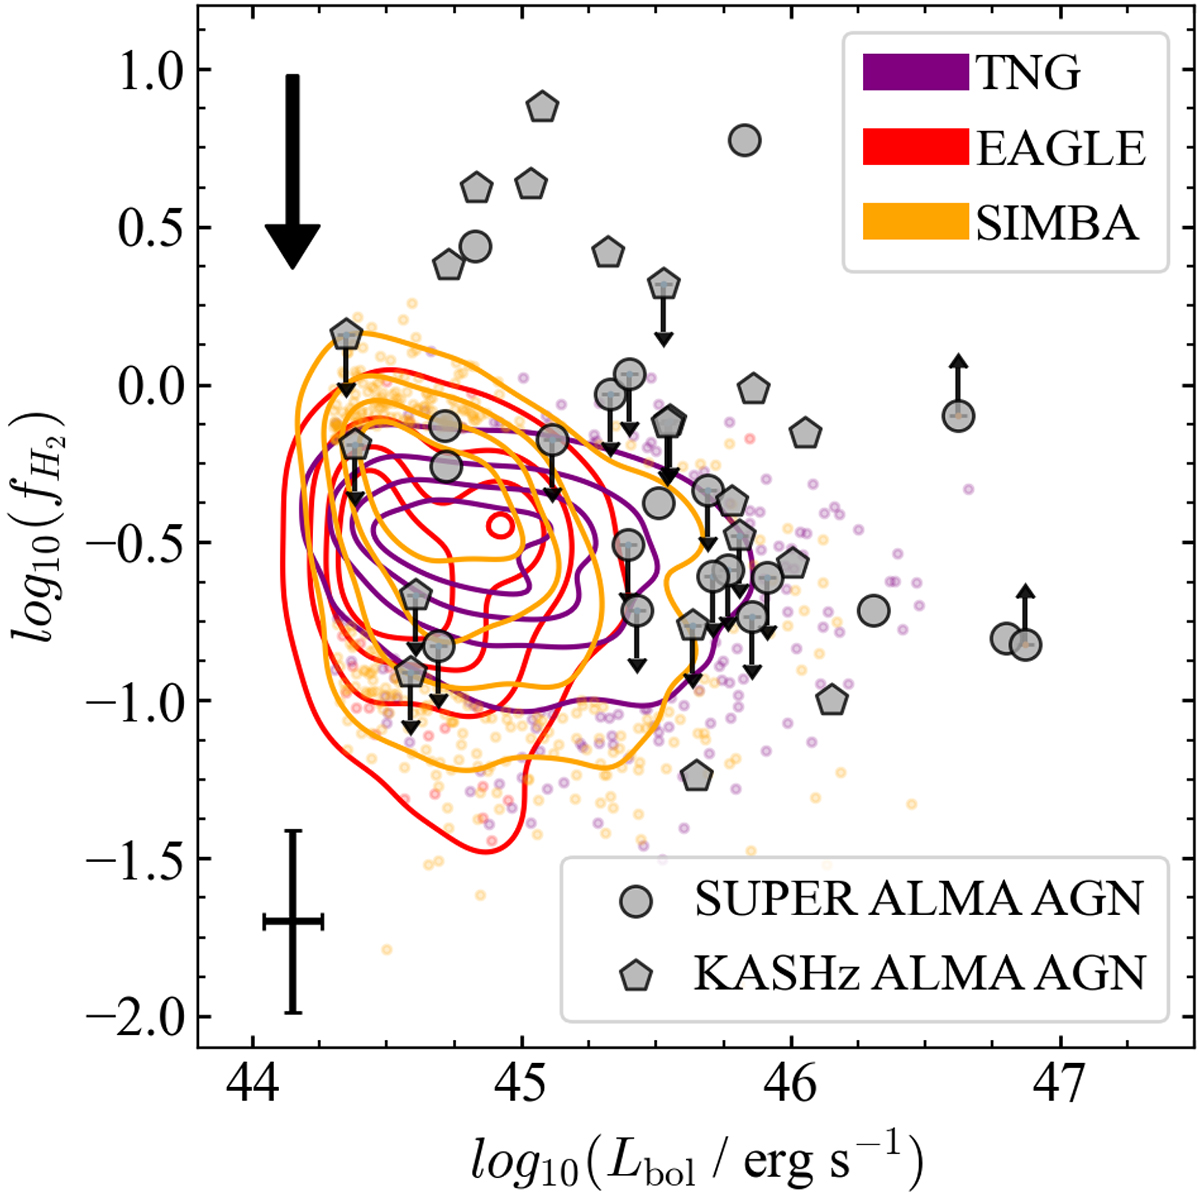
Download original image
Distribution of gas fraction fH2 vs. bolometric luminosity Lbol. Galaxies in the simulations are selected to match the observed parameter range in stellar mass and SFR, and to host AGN with Lbol > 1044.3 erg s−1 and λEdd > 0.01. Contours contain 90% of the selected systems and extreme outliers are shown as individual points. The color-coding for the simulations is as follows: EAGLE, TNG, and SIMBA in purple, red, and orange, respectively. Observational points are shown as gray pentagons for KASHz AGN (presented in this work) and gray circles for SUPER AGN from C21, scaled by αCO = 3.6 M⊙ (K km s−1 pc2)−1. The black arrow marks the downward shift for αCO = 0.8 M⊙ (K km s−1 pc2)−1. The bottom left point shows the mean error bar of the observational sample.
Current usage metrics show cumulative count of Article Views (full-text article views including HTML views, PDF and ePub downloads, according to the available data) and Abstracts Views on Vision4Press platform.
Data correspond to usage on the plateform after 2015. The current usage metrics is available 48-96 hours after online publication and is updated daily on week days.
Initial download of the metrics may take a while.