Fig. 7.
Download original image
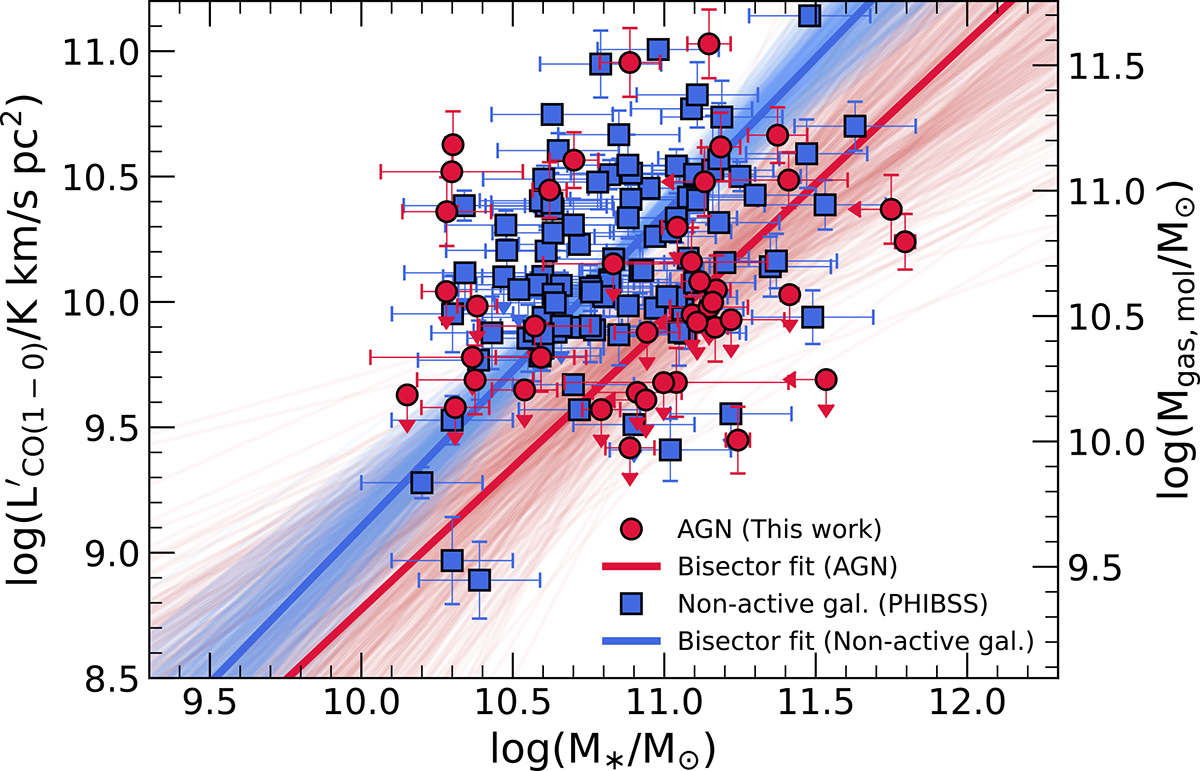
CO luminosity vs. stellar mass bisector fits of AGN host galaxies (red circles) and non-active galaxies of the control sample (blue squares). The thick lines mark the bisector fits obtained by adopting a Bayesian framework (see main text). The dispersion of the fits is given by plotting 500 realizations of the bisector fits. The vertical axis on the right is derived by assuming αCO = 3.6 M⊙/(K km s−1 pc2) and serves for illustration purposes only since we only consider L′CO in our quantitative analysis (see Sect. 5.3).
Current usage metrics show cumulative count of Article Views (full-text article views including HTML views, PDF and ePub downloads, according to the available data) and Abstracts Views on Vision4Press platform.
Data correspond to usage on the plateform after 2015. The current usage metrics is available 48-96 hours after online publication and is updated daily on week days.
Initial download of the metrics may take a while.