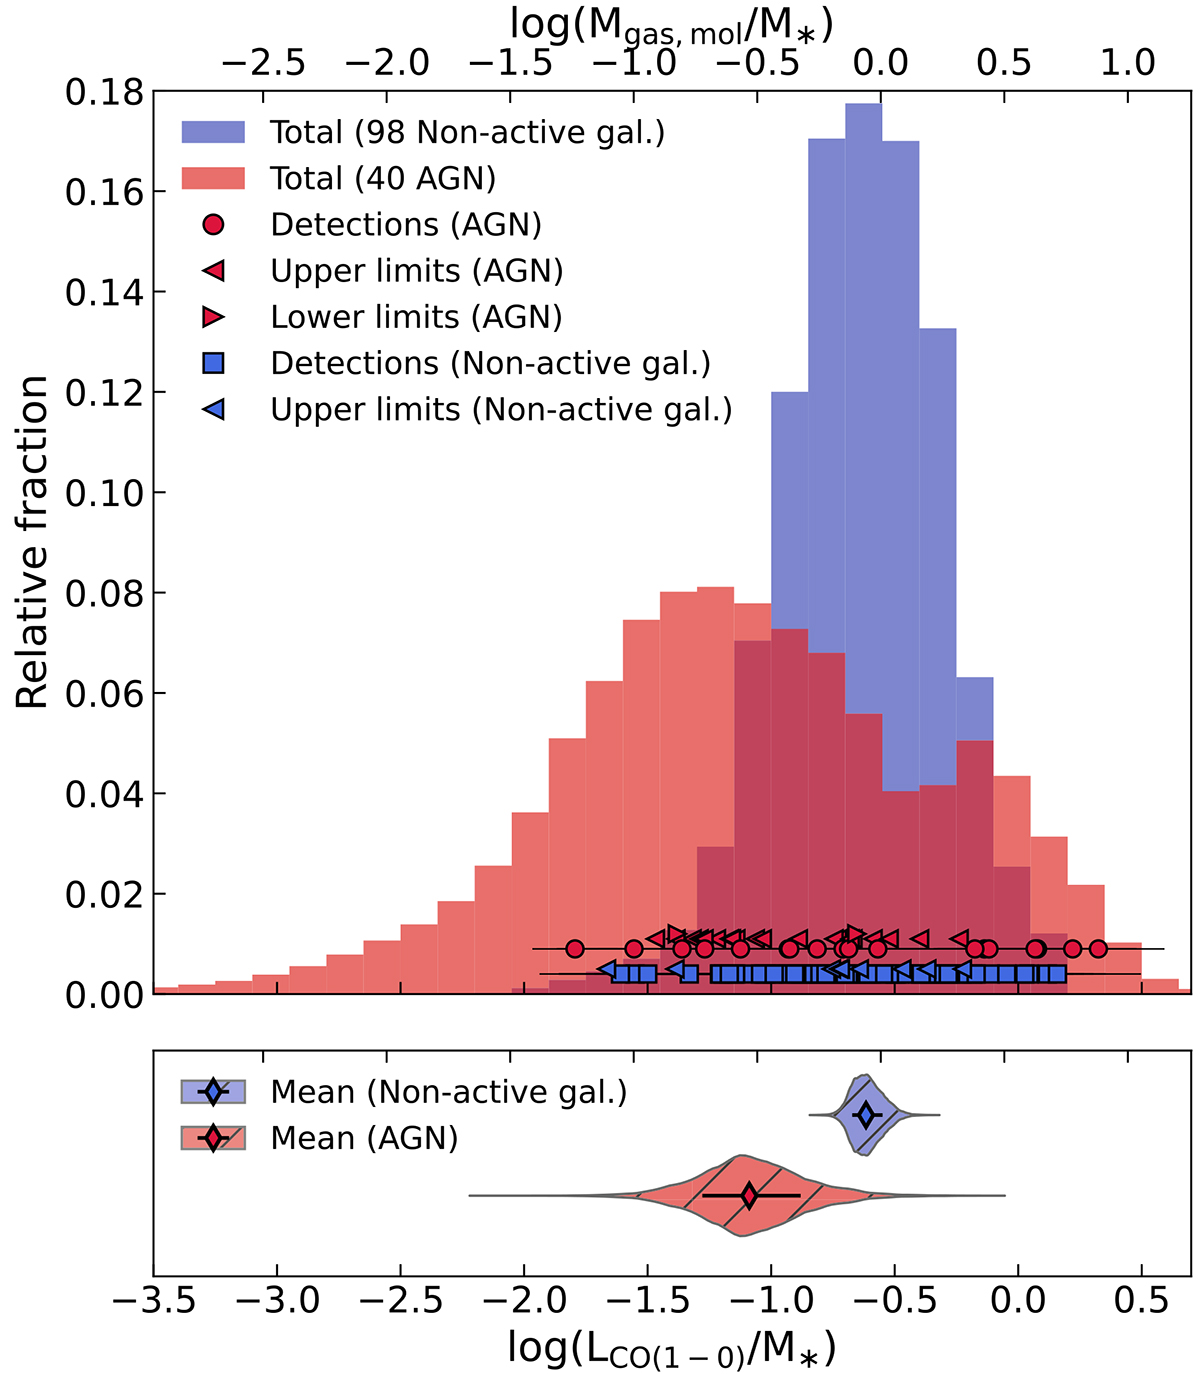
Fig. 6.
Download original image
Distribution of L′CO/M* (observational proxy of the gas fraction fgas) for AGN host galaxies (red) and non-active galaxies of the control sample (blue). Upper panel: filled histograms show the total distributions, obtained by joining the sampled posterior distribution of each target for both samples. The blue squares indicate the measure of each non-active galaxy (98 targets), red circles that of each AGN (40 targets). The blue and red triangles indicate upper limits if pointing leftward and lower limits if pointing rightward for the gas fraction of non-active galaxies and AGN, respectively. Lower panel: violin plots show the sampled posterior distribution of the mean of the hierarchical Gaussian prior used in our Bayesian analysis. The diamonds show the measured mean value μfgas of AGN (red) and non-active galaxies (blue). The top axis is derived by assuming αCO = 3.6 M⊙/(K km s−1 pc2) and serves for illustration purposes only since we only consider L′CO in our quantitative analysis (see Sect. 5.2).
Current usage metrics show cumulative count of Article Views (full-text article views including HTML views, PDF and ePub downloads, according to the available data) and Abstracts Views on Vision4Press platform.
Data correspond to usage on the plateform after 2015. The current usage metrics is available 48-96 hours after online publication and is updated daily on week days.
Initial download of the metrics may take a while.