Fig. 5.
Download original image
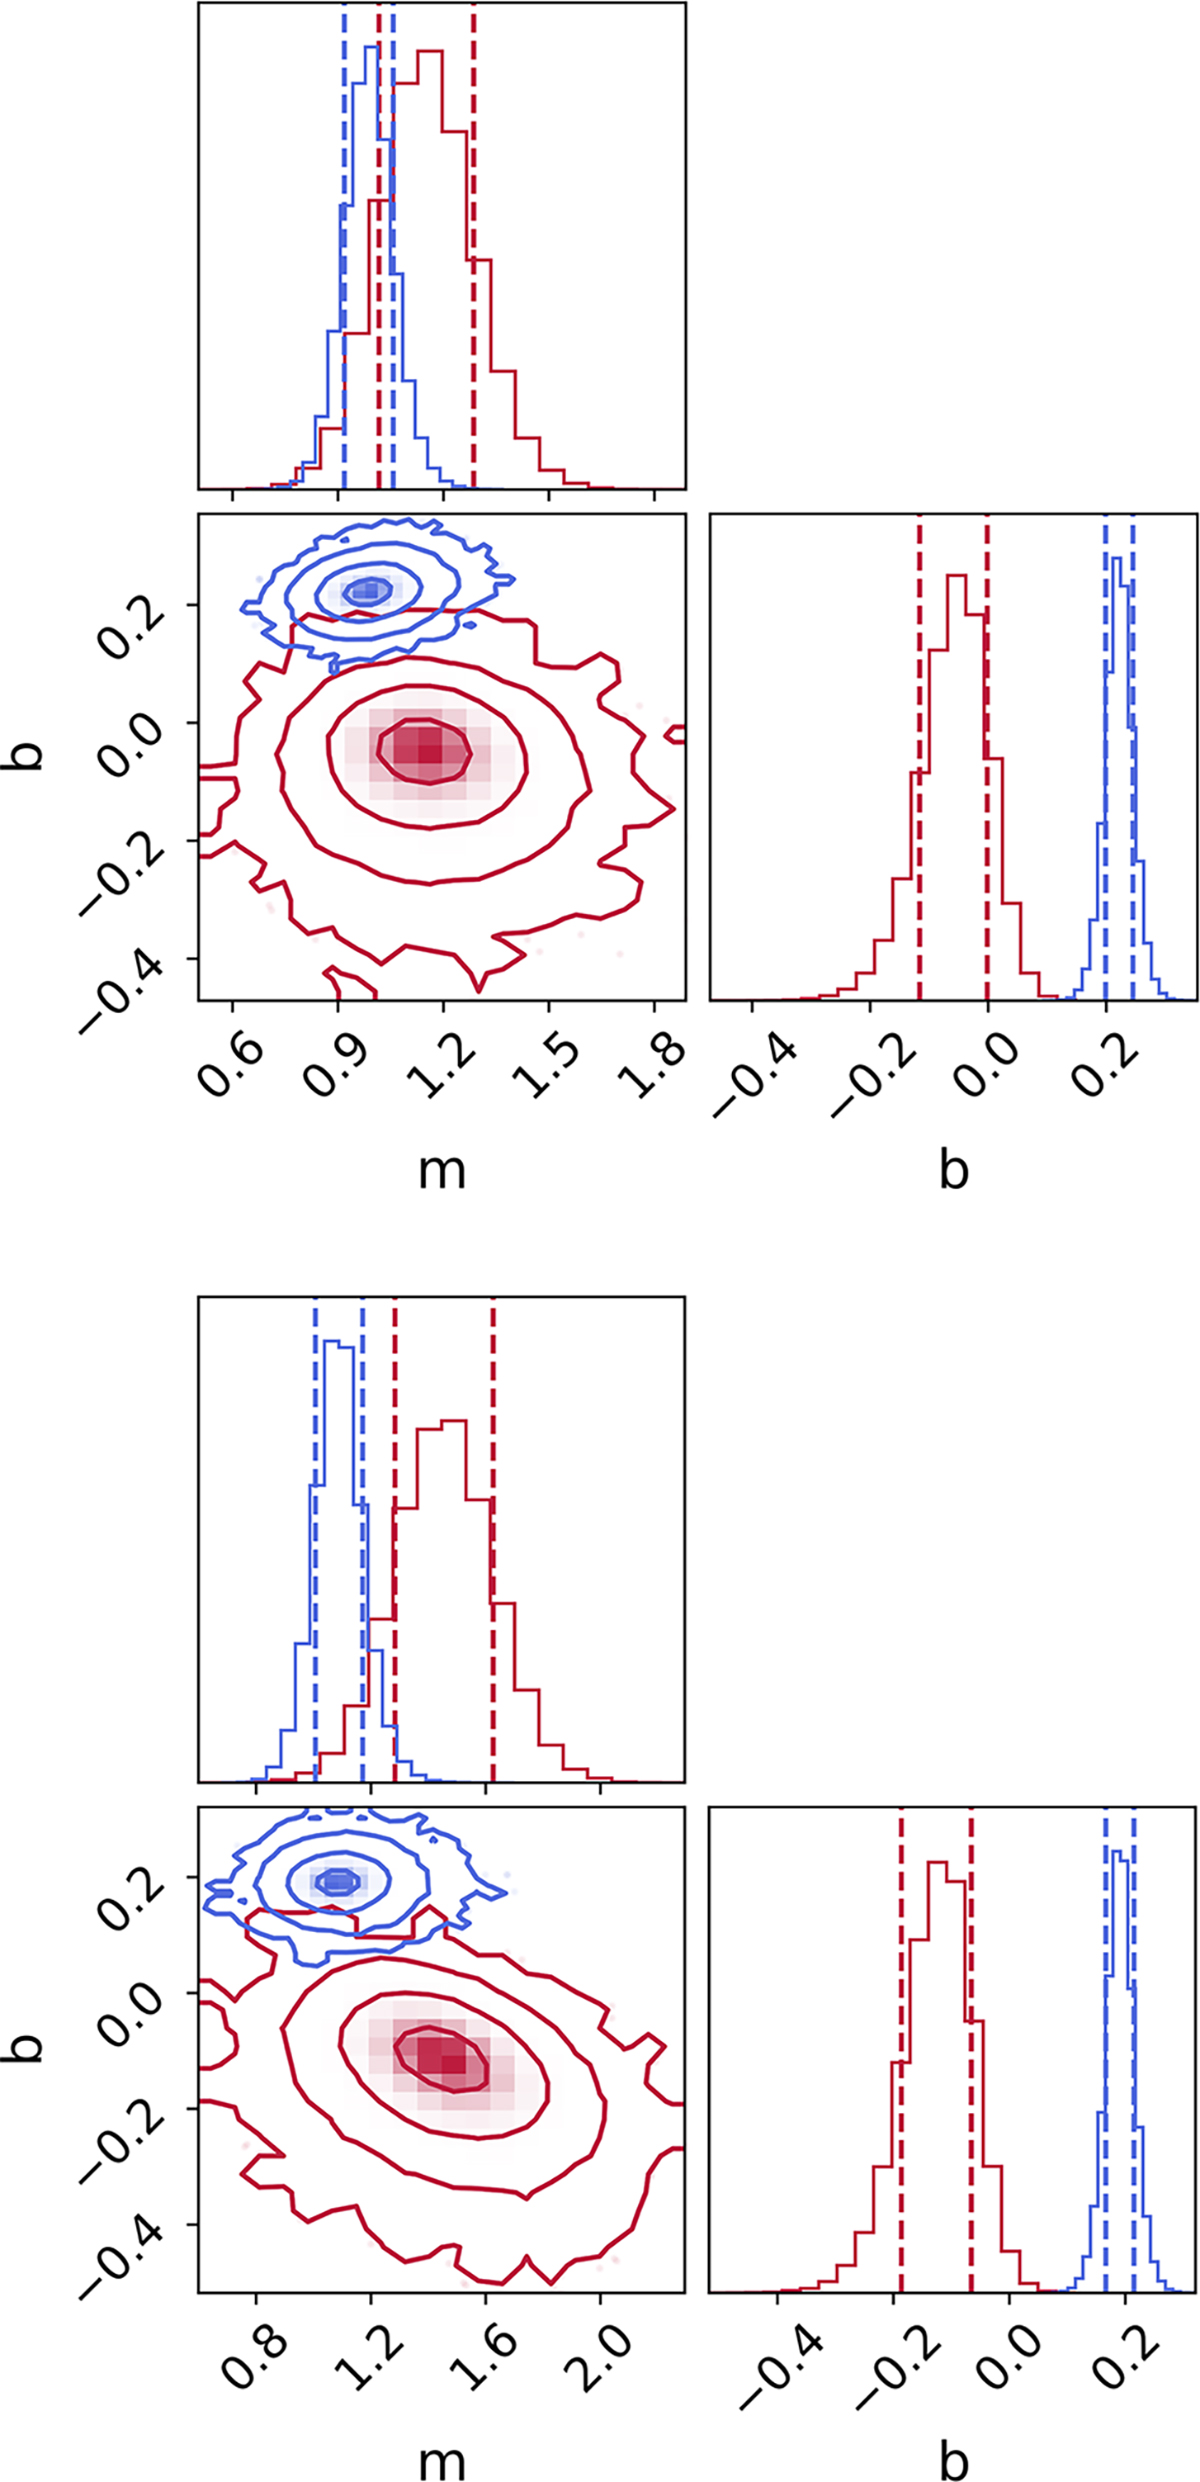
Corner plots of best-fit parameters for the log(![]() relation (see Sect. 5.1) for the full sample (top) and when removing AGN without a match in the control sample (bottom). Results of AGN host galaxies are shown in red, those of non-active galaxies in blue. The contours show the 1–4σ levels, from inner- to outermost, and increase linearly.
relation (see Sect. 5.1) for the full sample (top) and when removing AGN without a match in the control sample (bottom). Results of AGN host galaxies are shown in red, those of non-active galaxies in blue. The contours show the 1–4σ levels, from inner- to outermost, and increase linearly.
Current usage metrics show cumulative count of Article Views (full-text article views including HTML views, PDF and ePub downloads, according to the available data) and Abstracts Views on Vision4Press platform.
Data correspond to usage on the plateform after 2015. The current usage metrics is available 48-96 hours after online publication and is updated daily on week days.
Initial download of the metrics may take a while.