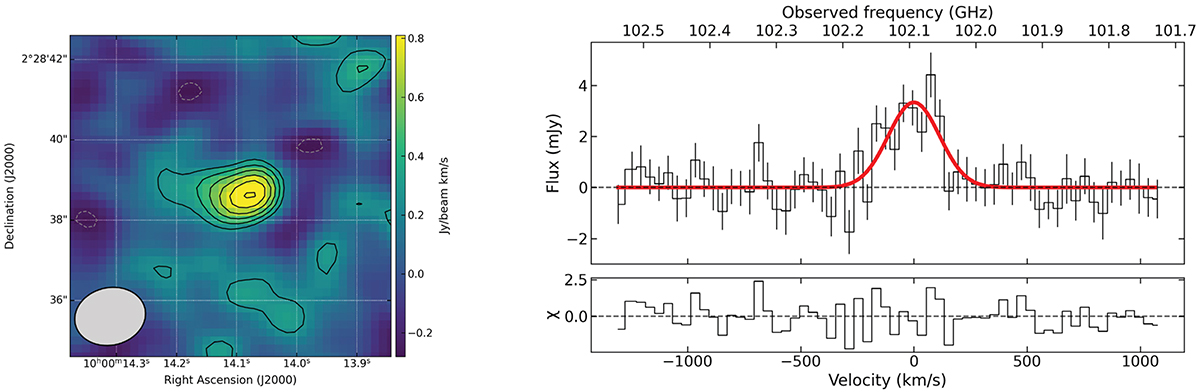
Fig. 3.
Download original image
CO line velocity-integrated emission map (left) and spectrum (right) of cid_108. The solid contour levels in the left panels start at 2σ and increase linearly. The dashed contours indicate the [−3,−2]×σ level. The beam of each observation is shown by the gray ellipse in the bottom left corner of each map. CO maps and spectra of the rest of the AGN sample are available on Zenodo at the following link: https://doi.org/10.5281/zenodo.13149280
Current usage metrics show cumulative count of Article Views (full-text article views including HTML views, PDF and ePub downloads, according to the available data) and Abstracts Views on Vision4Press platform.
Data correspond to usage on the plateform after 2015. The current usage metrics is available 48-96 hours after online publication and is updated daily on week days.
Initial download of the metrics may take a while.