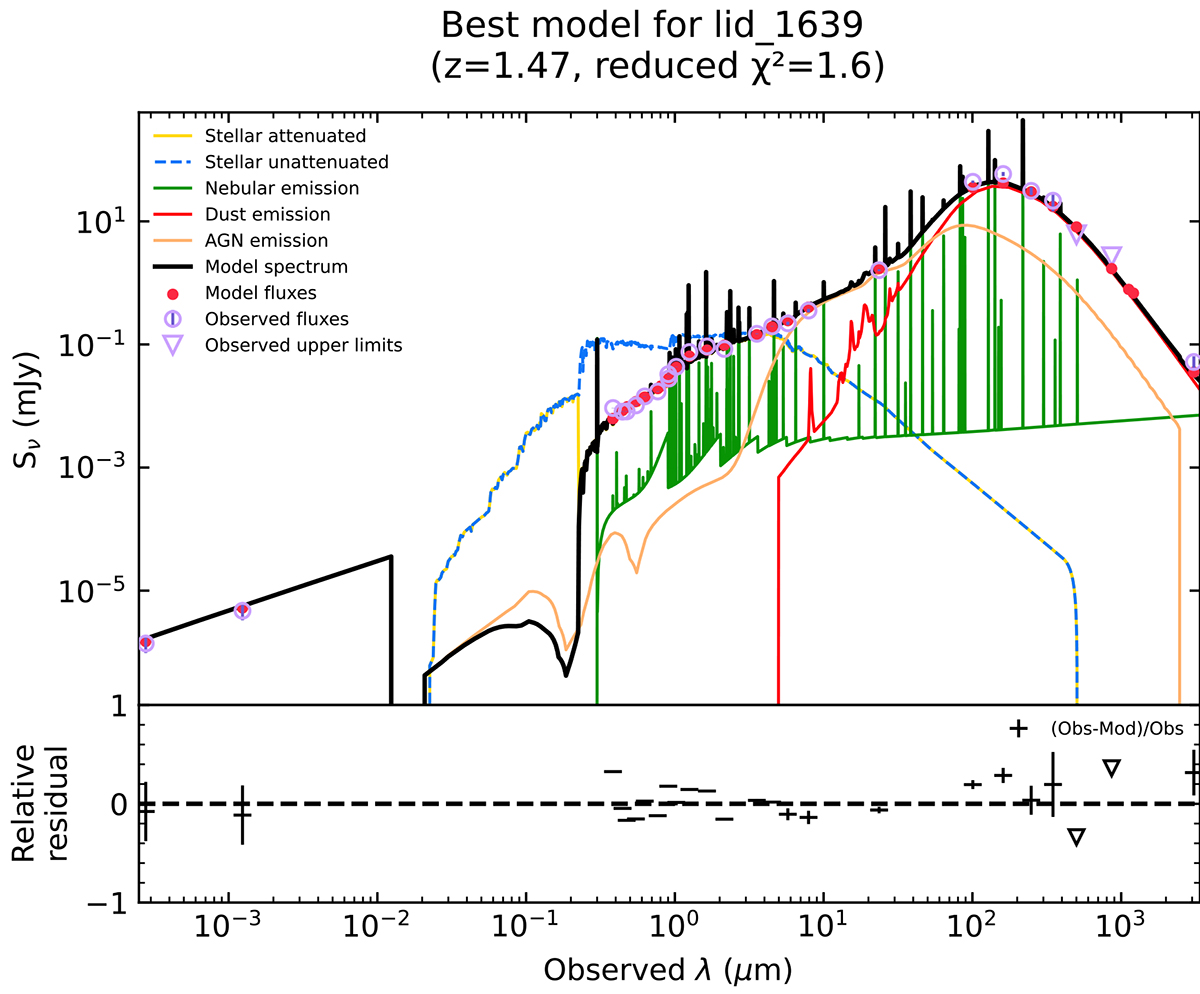
Fig. D.1.
Download original image
Observed-frame, best-fit SED models of lid_1639. Purple empty circles mark observed flux densities, purple empty triangles the observational upper limits and red filled circles indicate the best-fit model prediction. Yellow (blue dashed) lines are for the stellar (un)attenuated emisson; green lines for the nebular emission; red lines for dust emission; orange lines for the AGN component and black lines for the total, best-fit model. The SEDs of the rest of the AGN sample are available on Zenodo at the following link: https://doi.org/10.5281/zenodo.13149280.
Current usage metrics show cumulative count of Article Views (full-text article views including HTML views, PDF and ePub downloads, according to the available data) and Abstracts Views on Vision4Press platform.
Data correspond to usage on the plateform after 2015. The current usage metrics is available 48-96 hours after online publication and is updated daily on week days.
Initial download of the metrics may take a while.