Fig. B.1.
Download original image
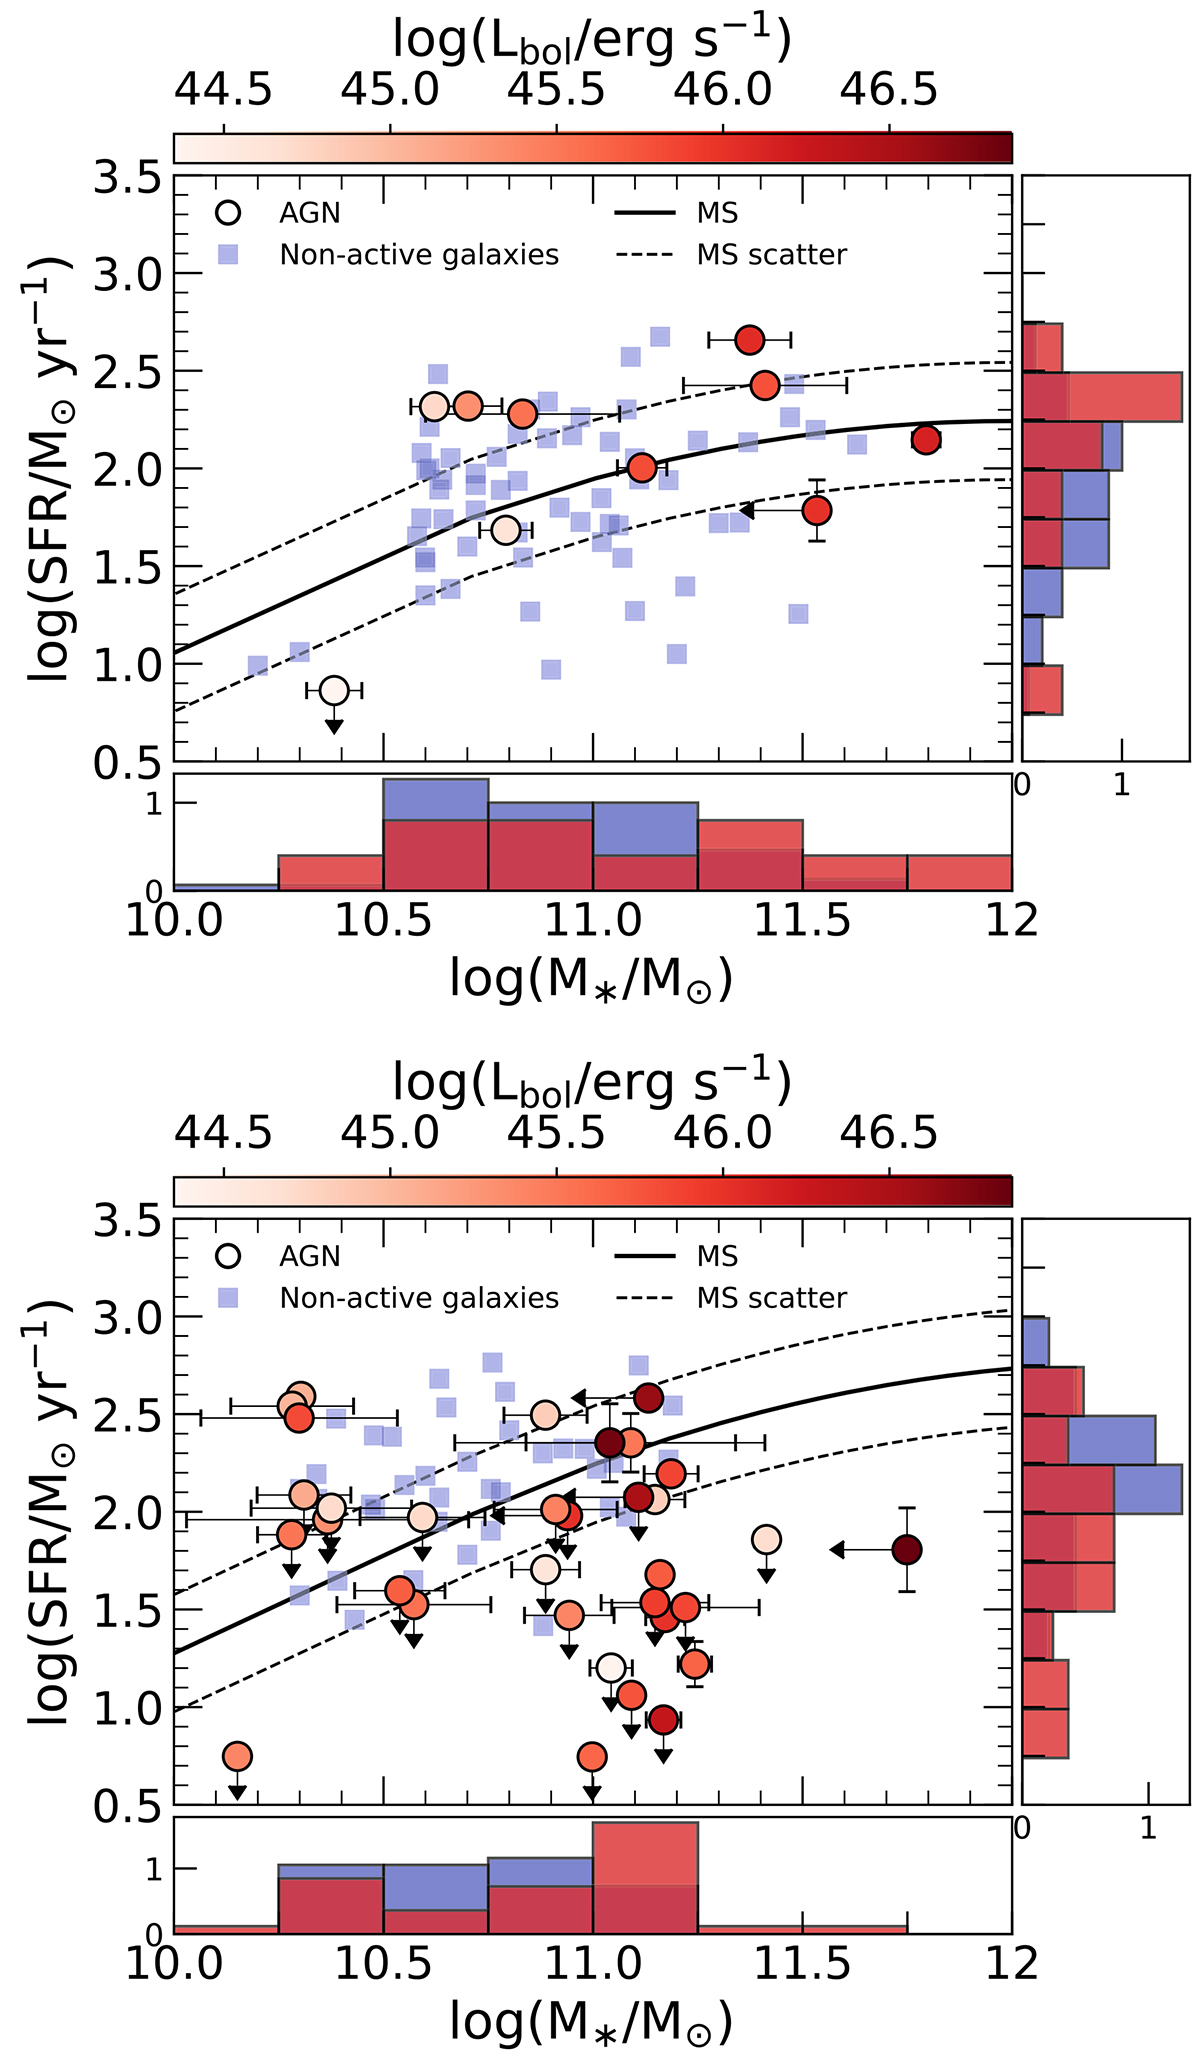
Comparison of SFR and stellar mass of AGN host galaxies (red circles) and non-active galaxies of the control sample (blue squares) for low-z bin (z = 1 − 1.8; Top) and high-z bin (z = 1.8 − 2.55; Bottom). Red circles are color-coded based on their AGN bolometric luminosity, as retrieved from SED fitting from this work or from the literature. The solid line marks the MS at the mean redshift of each bin from Schreiber et al. (2015) and dashed lines show its scatter (equal to 0.3 dex). The distribution of SFR (right) and M* (bottom) for AGN (red) and non-active galaxies (blue) in the side panels are intended for illustration purposes only, since the upper limits are considered at face value. A robust comparison of the distribution of SFR and M* applying the hierarchical method described in Sect. 5.2 is presented in Fig. B.2.
Current usage metrics show cumulative count of Article Views (full-text article views including HTML views, PDF and ePub downloads, according to the available data) and Abstracts Views on Vision4Press platform.
Data correspond to usage on the plateform after 2015. The current usage metrics is available 48-96 hours after online publication and is updated daily on week days.
Initial download of the metrics may take a while.