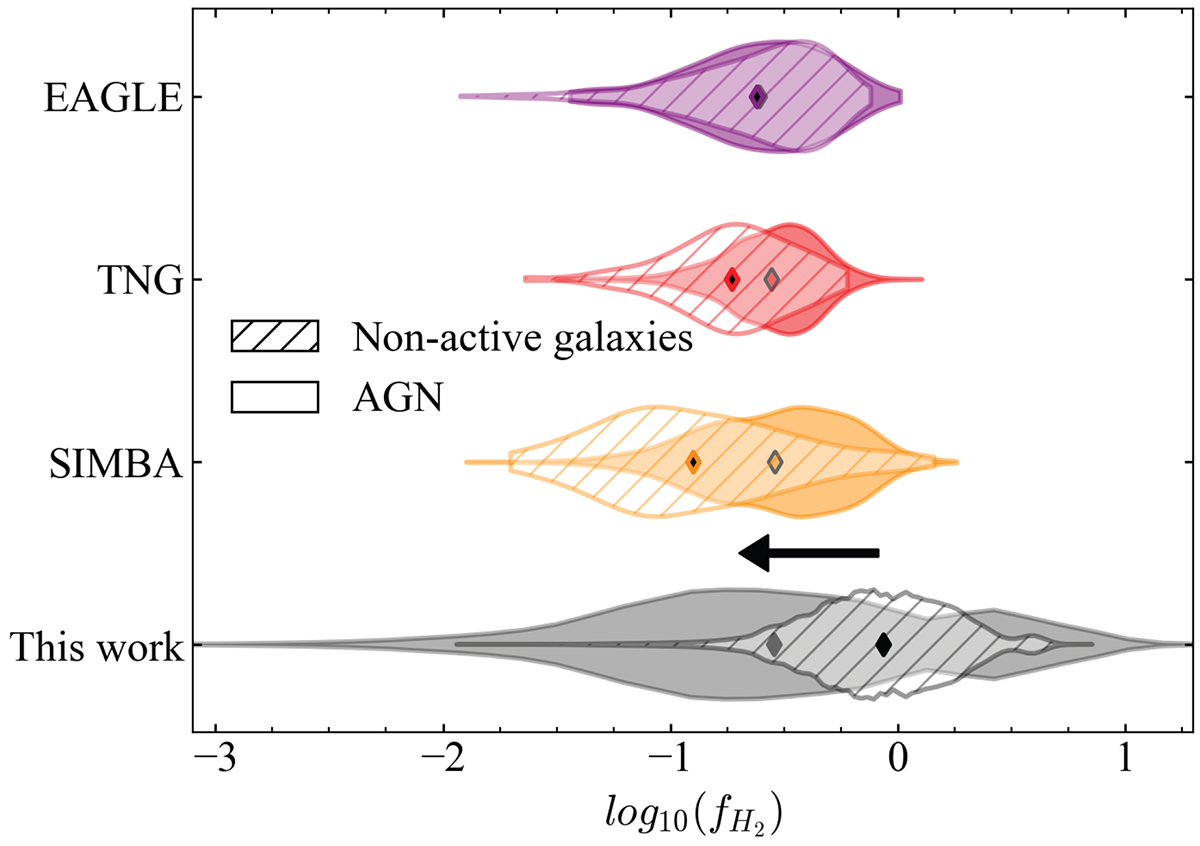
Fig. 11.
Download original image
Gas fraction distributions of AGN host galaxies (filled violin plots) and non-active galaxies (hatched violin plots) from cosmological simulations (EAGLE, TNG, and SIMBA in purple, red, and orange, respectively) and observations presented in this work (gray), scaled for αCO = 3.6 M⊙ (K km s−1 pc2)−1. The diamond markers give the mean value of each distribution. Gas fraction distributions from the observations correspond to the total gas fraction distributions built in Sect. 5.2. Galaxies in the simulations are filtered as in Fig. 9. The black arrow marks the leftward shift of observed distributions (black) for αCO = 0.8 M⊙ (K km s−1 pc2)−1.
Current usage metrics show cumulative count of Article Views (full-text article views including HTML views, PDF and ePub downloads, according to the available data) and Abstracts Views on Vision4Press platform.
Data correspond to usage on the plateform after 2015. The current usage metrics is available 48-96 hours after online publication and is updated daily on week days.
Initial download of the metrics may take a while.