Fig. 10.
Download original image
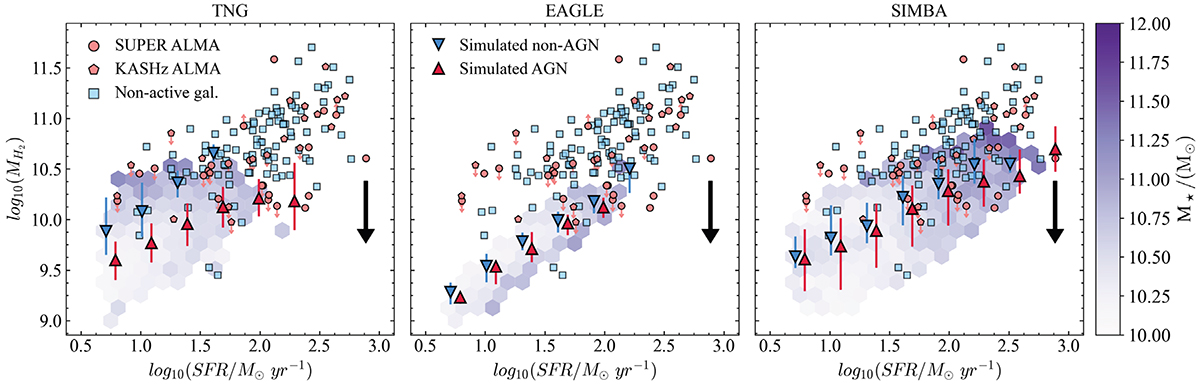
Comparison of molecular gas fraction against SFR of AGN (red) and non-active galaxies (blue) from observations and simulations. SUPER ALMA targets are shown as red circles, KASHz AGN as red pentagons, and observed non-active galaxies as blue squares. Blue downward triangles and red upward triangles show the median and 16th–84th percentiles of non-active galaxies and AGN in the simulations, respectively, grouped in SFR bins of 0.3 dex. Hexagons show the distribution of simulated AGN and are color-coded based on the mean stellar mass of the host galaxies in each bin. Observed molecular gas fractions are computed assuming αCO = 3.6 M⊙ (K km s−1 pc2)−1. Galaxies in the simulations are filtered to match the observed properties of the observed galaxies. The black arrow marks the downward shift for αCO = 0.8 M⊙ (K km s−1 pc2)−1.
Current usage metrics show cumulative count of Article Views (full-text article views including HTML views, PDF and ePub downloads, according to the available data) and Abstracts Views on Vision4Press platform.
Data correspond to usage on the plateform after 2015. The current usage metrics is available 48-96 hours after online publication and is updated daily on week days.
Initial download of the metrics may take a while.