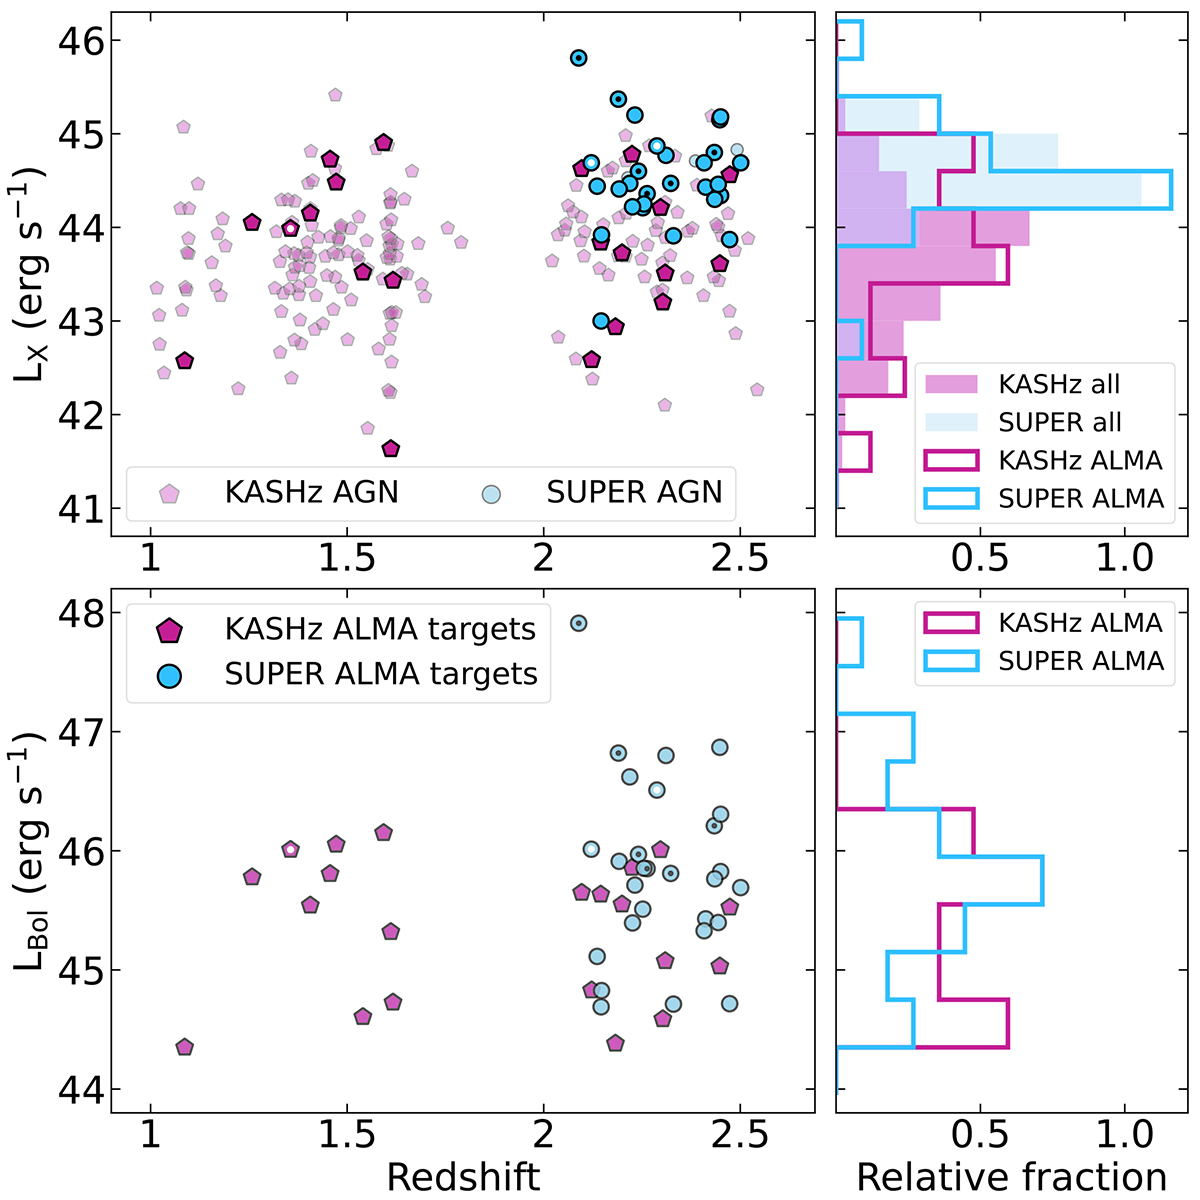
Fig. 1.
Download original image
Luminosity versus redshift distribution of the AGN samples used in this work. Top: intrinsic 2–10 keV rest-frame X-ray luminosity LX vs. redshift z distribution of the full KASHz (purple pentagons) and SUPER (blue circles) surveys. SUPER ALMA targets are from C21. The side panel shows the density distribution of SUPER (blue) and KASHz (purple) targets. Bottom: bolometric luminosity LBol vs. redshift z distribution of the AGN targeted by ALMA and included in this work. For the KASHz (purple pentagons) and SUPER (blue circles) targets included in this panel, the bolometric luminosity was derived from SED fitting in this work (see Appendix D), in C18, and in C21. The side panel shows the density distribution of the samples. The black dots mark the six targets discarded because they were missing at least one parameter of interest for our analysis; the white dots mark the three targets that do not allow fgas to be computed.
Current usage metrics show cumulative count of Article Views (full-text article views including HTML views, PDF and ePub downloads, according to the available data) and Abstracts Views on Vision4Press platform.
Data correspond to usage on the plateform after 2015. The current usage metrics is available 48-96 hours after online publication and is updated daily on week days.
Initial download of the metrics may take a while.