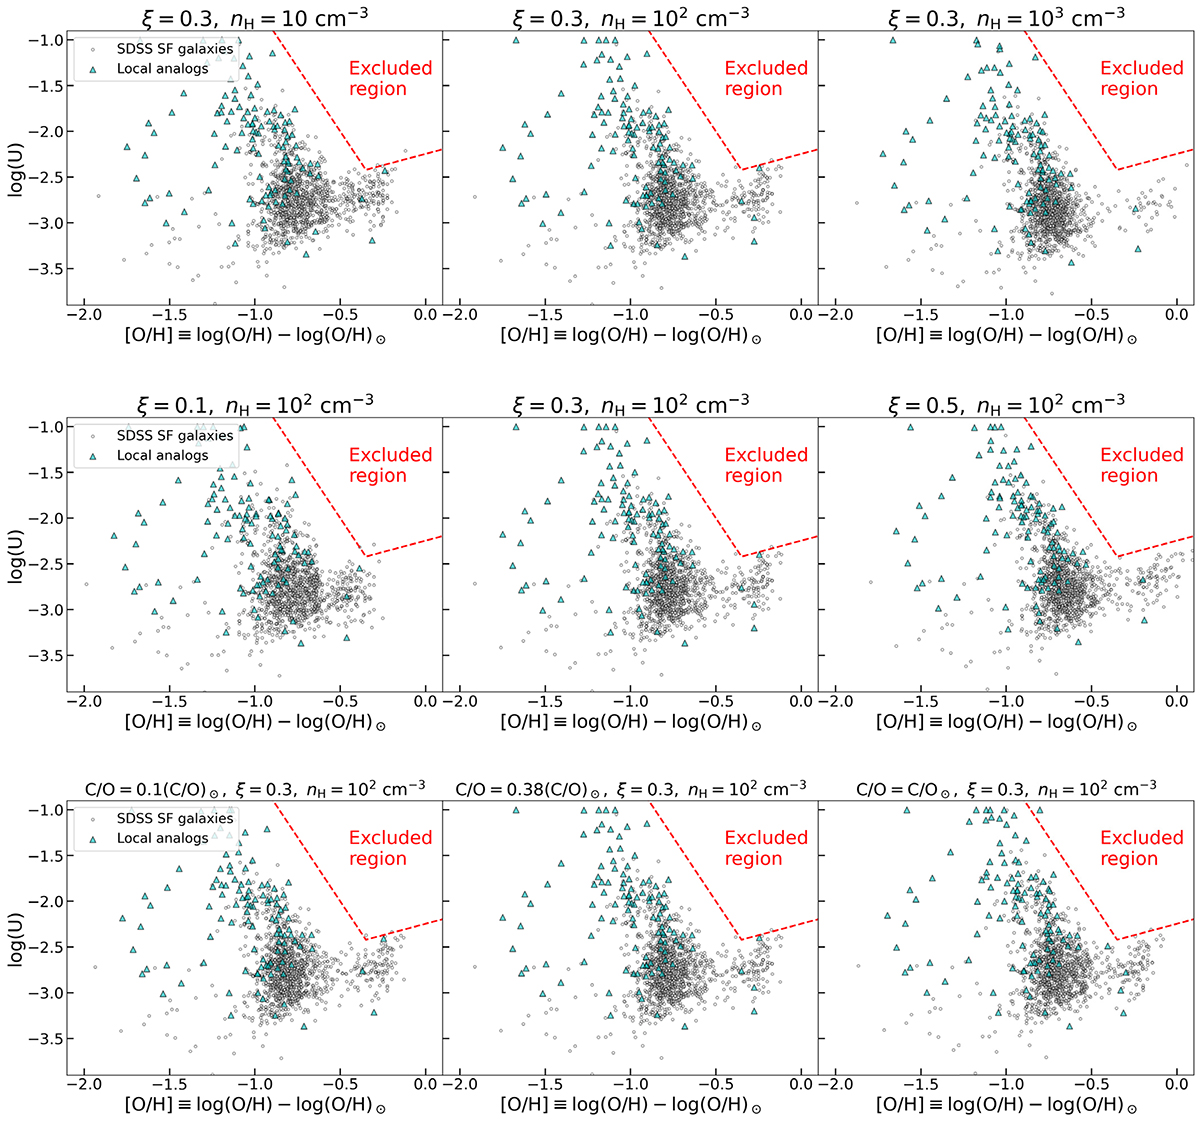
Fig. A.1.
Download original image
Distribution of the SDSS SFG sample (circles) and local analogues (triangles) in the log U vs log OH plane, according to the likelihood procedure with the Feltre et al. (2016) models described in Sect. 2.3. In each panel, we also show (red dashed line), the region of the parameter space that we decided to exclude, a posteriori, from the same photoionization models. The upper panels show the variation in the distribution of the sources by considering models with different electron densities nH. The middle panels show different dust-to-metal ratios ξ, the bottom panels different C/O abundance. The excluded region is never significantly populated by any source in all the panels.
Current usage metrics show cumulative count of Article Views (full-text article views including HTML views, PDF and ePub downloads, according to the available data) and Abstracts Views on Vision4Press platform.
Data correspond to usage on the plateform after 2015. The current usage metrics is available 48-96 hours after online publication and is updated daily on week days.
Initial download of the metrics may take a while.