Open Access
Fig. 2.
Download original image
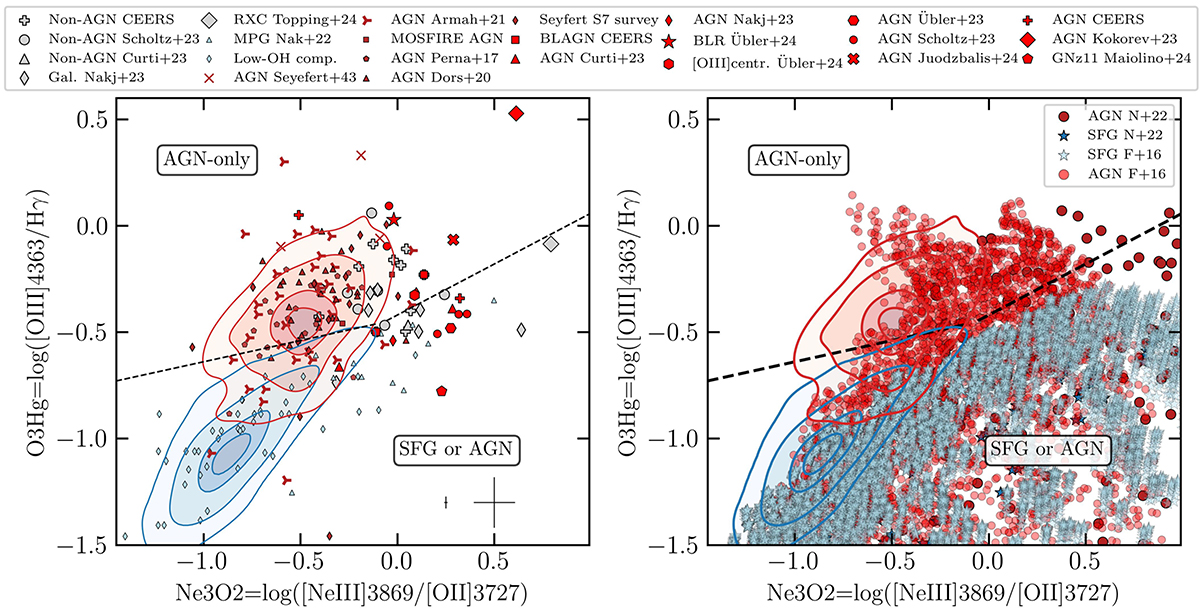
Same as Fig. 1, but for the line ratios [OIII]λ4363/Hγ vs [Ne III]λ3869/[OII]λ3727. Based on the distribution of observational samples and models, this diagnostic diagram also identifies a region that can be populated only by AGN.
Current usage metrics show cumulative count of Article Views (full-text article views including HTML views, PDF and ePub downloads, according to the available data) and Abstracts Views on Vision4Press platform.
Data correspond to usage on the plateform after 2015. The current usage metrics is available 48-96 hours after online publication and is updated daily on week days.
Initial download of the metrics may take a while.