Open Access
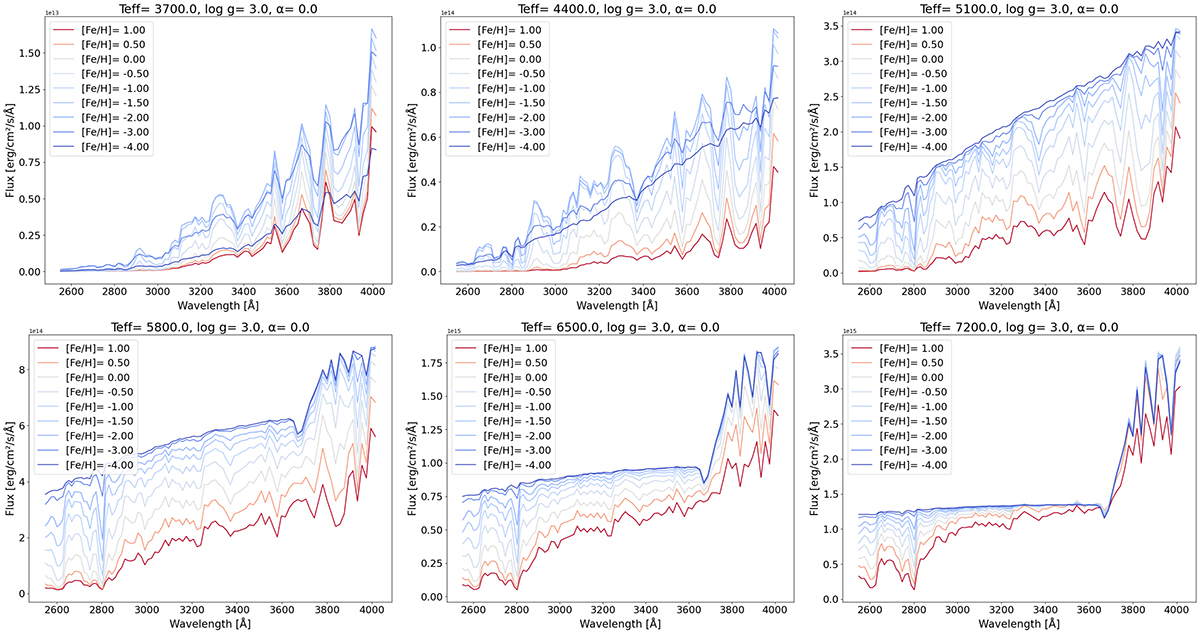
Fig. 6.
Download original image
UV band spectra at mid-to-low Teff. These subplots show the UV spectral flux under various mid-to-low Teff (from 3700 K to 7200 K) and a constant log g (e.g. log g = 3.0), with varying [Fe/H] (ranging from +1.0 to −4.0).
Current usage metrics show cumulative count of Article Views (full-text article views including HTML views, PDF and ePub downloads, according to the available data) and Abstracts Views on Vision4Press platform.
Data correspond to usage on the plateform after 2015. The current usage metrics is available 48-96 hours after online publication and is updated daily on week days.
Initial download of the metrics may take a while.