Fig. 4.
Download original image
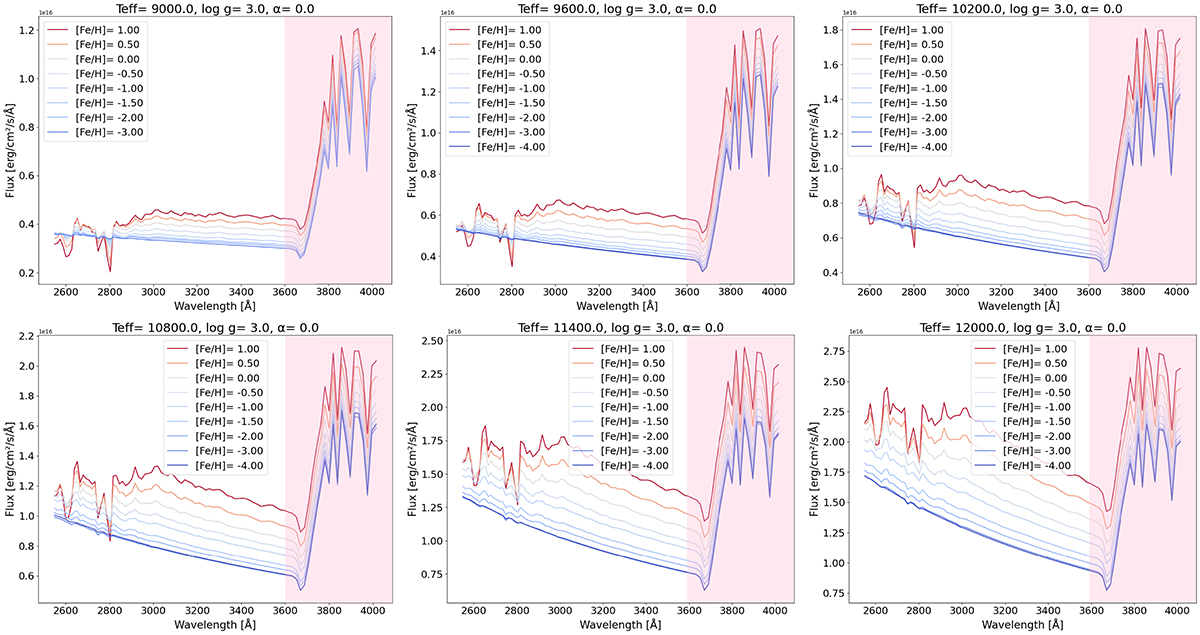
UV band spectra at different Teff and log g. These subplots show the spectra flux under varying Teff (ranging from 3800 K to 12 000 K) and log g (ranging from +1.0 to +6.0), with [Fe/H] changing from metal-rich ([Fe/H] = +1.0) to EMP ([Fe/H] = −4.0). The red curves generally represent higher [Fe/H], while blue curves represent lower [Fe/H]. The transition from red to blue corresponds to the change from high to low [Fe/H], where each curve represents a specific level of [Fe/H].
Current usage metrics show cumulative count of Article Views (full-text article views including HTML views, PDF and ePub downloads, according to the available data) and Abstracts Views on Vision4Press platform.
Data correspond to usage on the plateform after 2015. The current usage metrics is available 48-96 hours after online publication and is updated daily on week days.
Initial download of the metrics may take a while.