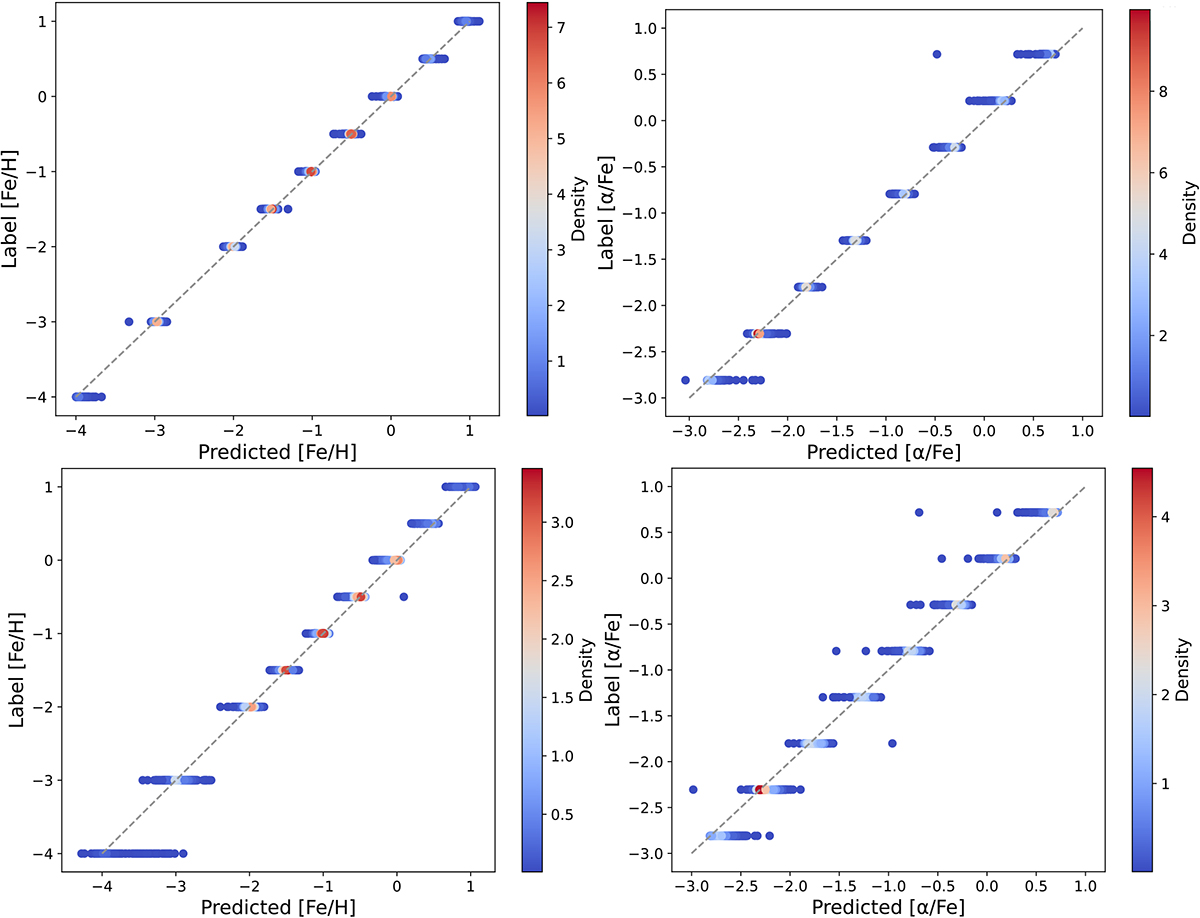
Fig. 3.
Download original image
Prediction results for [Fe/H] and [α/Fe] with and without the UV band spectra (ranging from 2550–10 000 Å and 4000–10 000 Å, respectively). The top panels compare the predicted and actual values of [Fe/H] and [α/Fe] when the UV band spectra are included. The colour intensity represents the density of data points, ranging from blue (low density) to red (high density). The dashed lines represent the identity line. The bottom panels show the prediction results without the UV band spectra.
Current usage metrics show cumulative count of Article Views (full-text article views including HTML views, PDF and ePub downloads, according to the available data) and Abstracts Views on Vision4Press platform.
Data correspond to usage on the plateform after 2015. The current usage metrics is available 48-96 hours after online publication and is updated daily on week days.
Initial download of the metrics may take a while.