Fig. 1.
Download original image
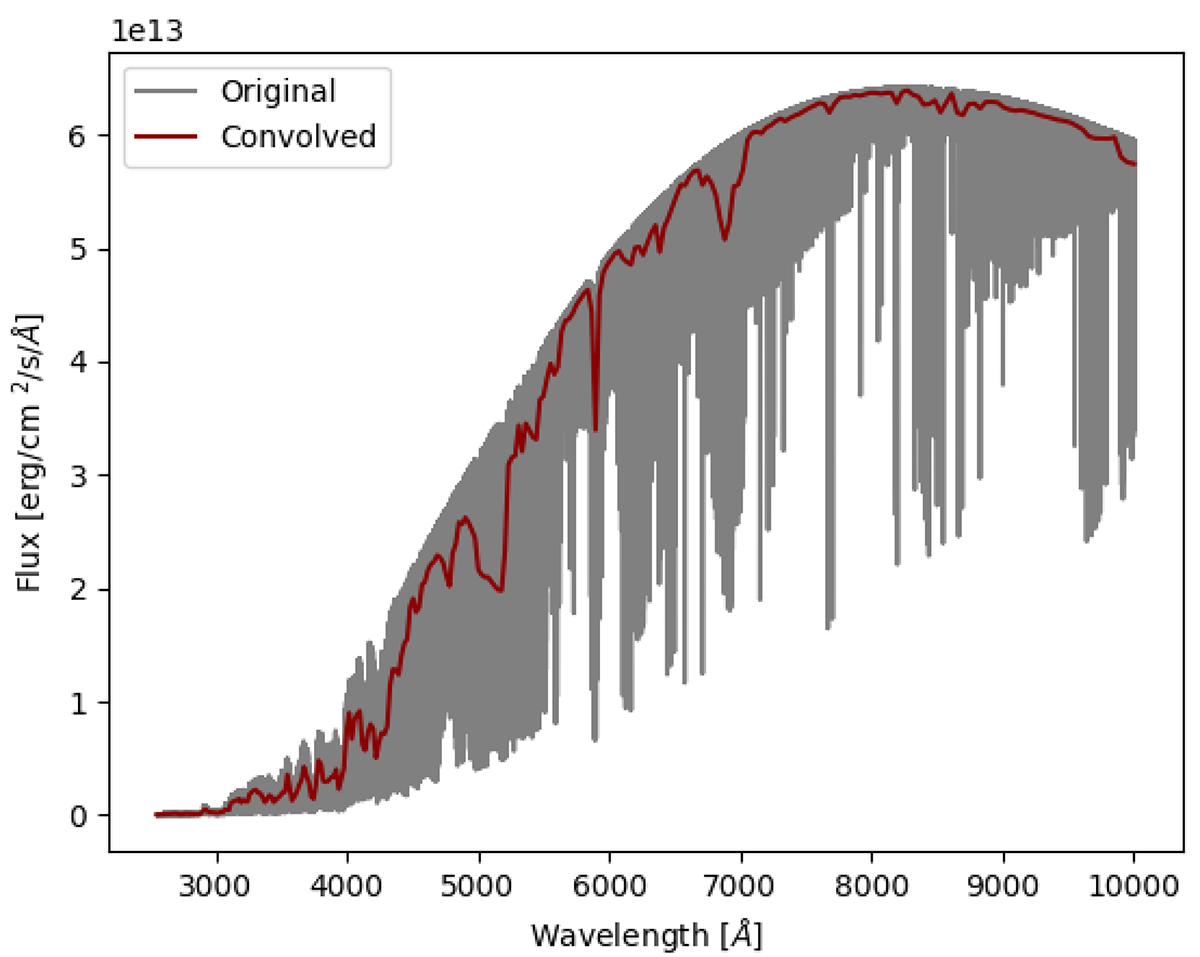
Comparative spectral profiles pre- and post-resolution reduction for a stellar model with Teff = 3500 K, log g = +4.0, and [α/Fe]= + 3.0. The grey curve depicts the original high-resolution spectrum. The red curve illustrates the spectrum after Gaussian convolution processing, which reduces the resolution to simulate the observational effect of the CSST. The wavelength range extends from 2550 to 10 000 Å, displaying the changes from the UV to the NIR region following the resolution-degradation process.
Current usage metrics show cumulative count of Article Views (full-text article views including HTML views, PDF and ePub downloads, according to the available data) and Abstracts Views on Vision4Press platform.
Data correspond to usage on the plateform after 2015. The current usage metrics is available 48-96 hours after online publication and is updated daily on week days.
Initial download of the metrics may take a while.