Fig. 7.
Download original image
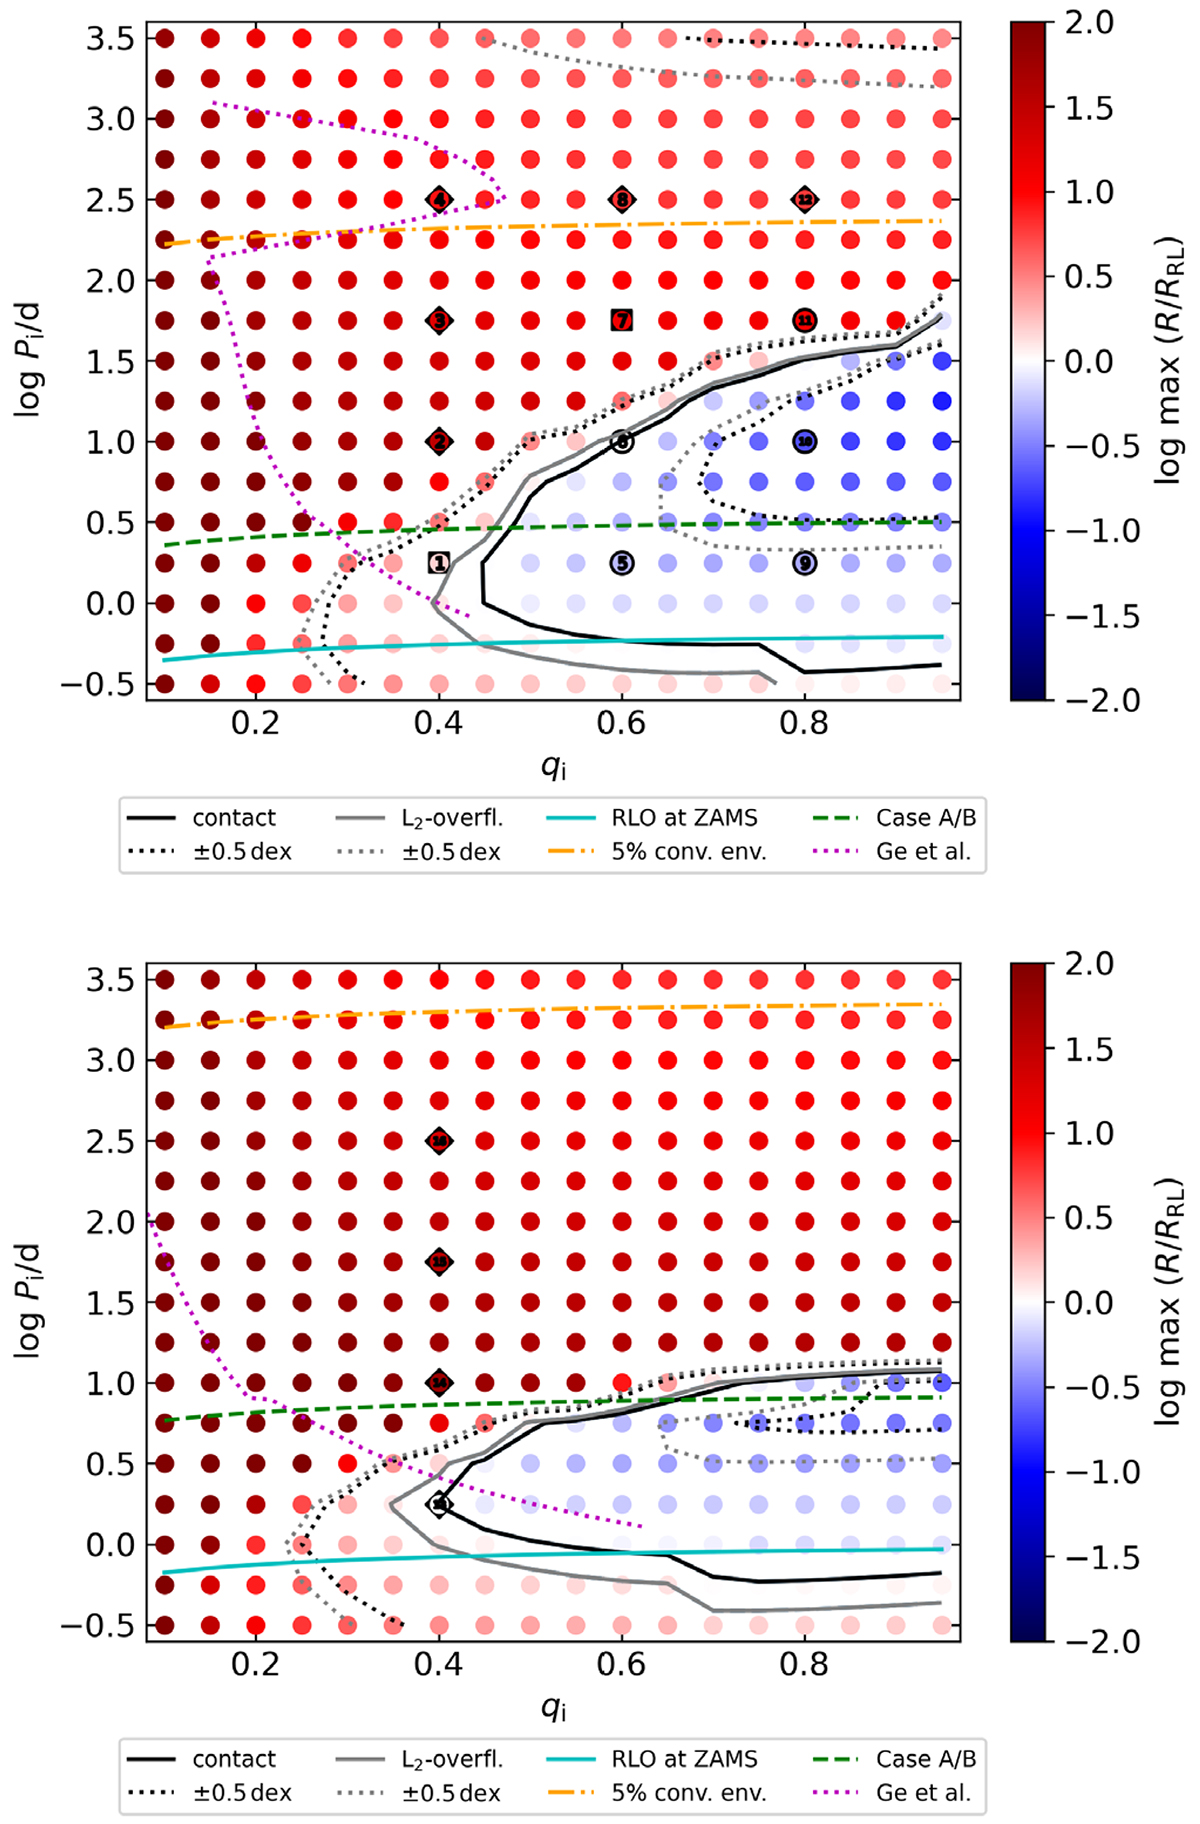
Maximum ratio of the accretor radius to its Roche radius over the course of the RLO as a function of initial mass and initial orbital period in our simulated binary systems. Red means that the accretor star swells to become larger than its Roche lobe, and blue indicates that it remains within its Roche lobe. The black line marks the boundary between these, and in grey, we show the boundary for the L2 radius instead of the Roche radius. The dotted black and grey lines indicate a shift of ±0.5 dex in the two boundaries. The initial donor masses are 10 M⊙ (top) and 30 M⊙ (bottom), the mass-transfer efficiency is 50%, and we assume that the ejected material carries the specific orbital angular momentum of the accretor (α = η = 0, β = −ε, B = 1). We show the region in which RLO at ZAMS is expected (solid cyan line), the boundary between Case A and Case B (dashed green line), the onset of the donor convective envelope (dot-dashed orange line), and the critical mass ratio according to Ge et al. (2010, 2015, 2020), pink dotted line). Systems marked with numbers and black symbols are those for which we computed detailed models (see Table 2). The black circles indicate stable swelling without contact formation, squares stand for stable swelling but L2 overflow, and diamonds indicate unstable swelling with L2 overflow.
Current usage metrics show cumulative count of Article Views (full-text article views including HTML views, PDF and ePub downloads, according to the available data) and Abstracts Views on Vision4Press platform.
Data correspond to usage on the plateform after 2015. The current usage metrics is available 48-96 hours after online publication and is updated daily on week days.
Initial download of the metrics may take a while.