Fig. 6.
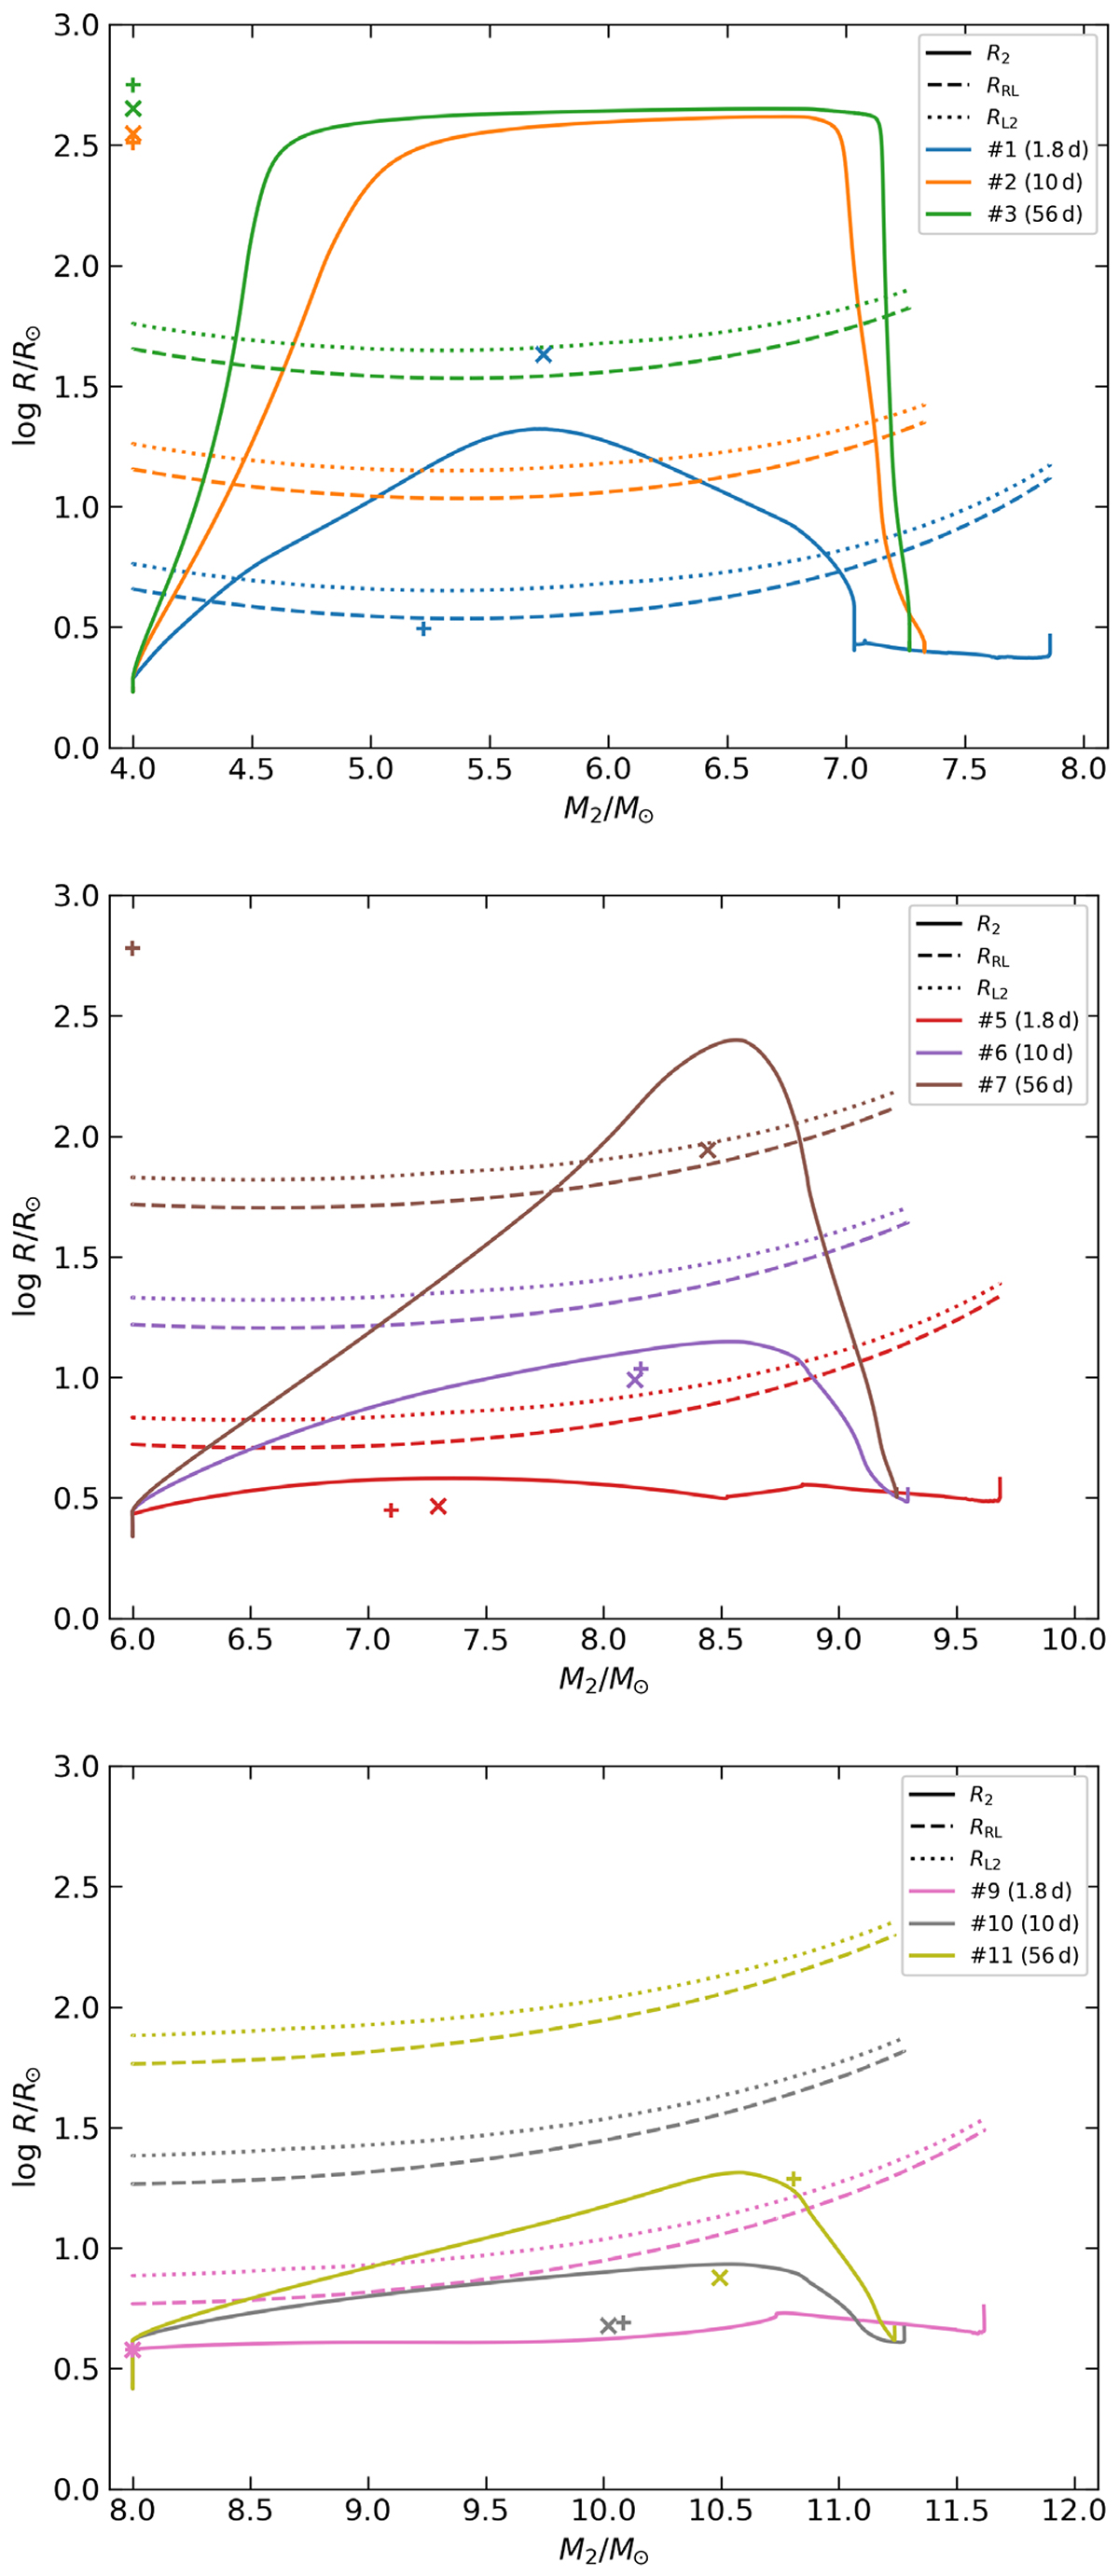
Download original image
Mass-radius evolution (solid line) of detailed accretor models for different initial periods (colour) and initial accretor masses (top 4 M⊙, middle 6 M⊙, bottom 8 M⊙). The donor always has an initial mass of 10 M⊙. The size of the accretor Roche lobe and L2 sphere are shown as dashed and dotted lines. We used crosses to indicate the maximum of the mass-radius curve (Rmax, MR = Rmax) according to Eqs. (7) and (8), based on the maximum mass-transfer rate of the detailed model. The plusses indicate the same, but for an estimate of the mass-transfer rate based on the conditions just before the RLO (Eq. (9)). When a symbol is placed at a high radius but at the initial mass of the model, the model is expected to swell unstably, and the radius is the Hayashi radius (see Sect. 3.1).
Current usage metrics show cumulative count of Article Views (full-text article views including HTML views, PDF and ePub downloads, according to the available data) and Abstracts Views on Vision4Press platform.
Data correspond to usage on the plateform after 2015. The current usage metrics is available 48-96 hours after online publication and is updated daily on week days.
Initial download of the metrics may take a while.