Fig. 1.
Download original image
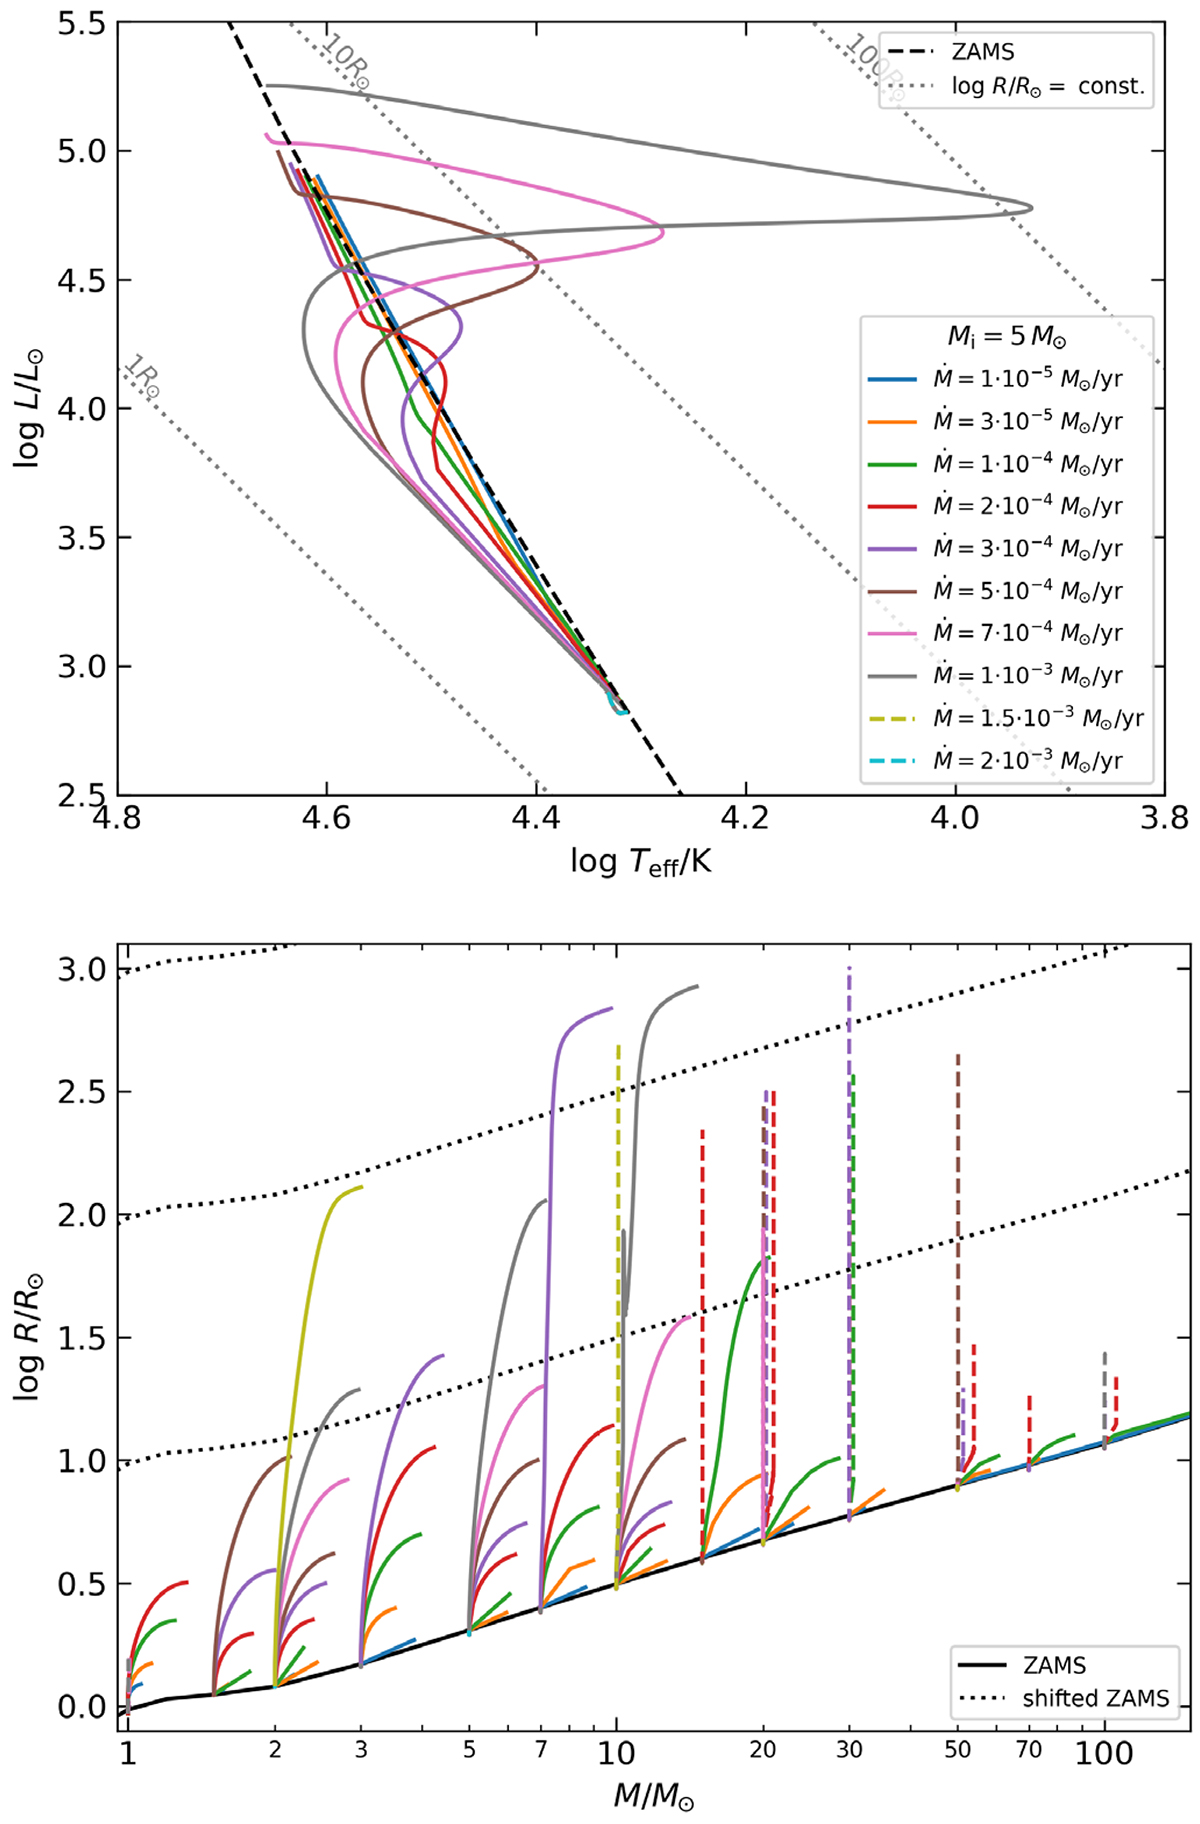
Evolution of our accreting single-star models. Top: Evolution of the 5 M⊙ models in the HRD for different accretion rates (indicated by colour). Stably swelling models are shown with solid lines, and unstable models are plotted with dashed lines. We also show the ZAMS (black) and various lines of a constant radius (grey). Bottom: Radius of accreting models as a function of mass until they reach maximum radius. For each initial mass, the colours are the same as in the corresponding HRDs (top panel and Sect. 4). Models that become unstable are indicated by dashed lines. Some are so short that they are hardly visible. The ZAMS radius is shown in black.
Current usage metrics show cumulative count of Article Views (full-text article views including HTML views, PDF and ePub downloads, according to the available data) and Abstracts Views on Vision4Press platform.
Data correspond to usage on the plateform after 2015. The current usage metrics is available 48-96 hours after online publication and is updated daily on week days.
Initial download of the metrics may take a while.