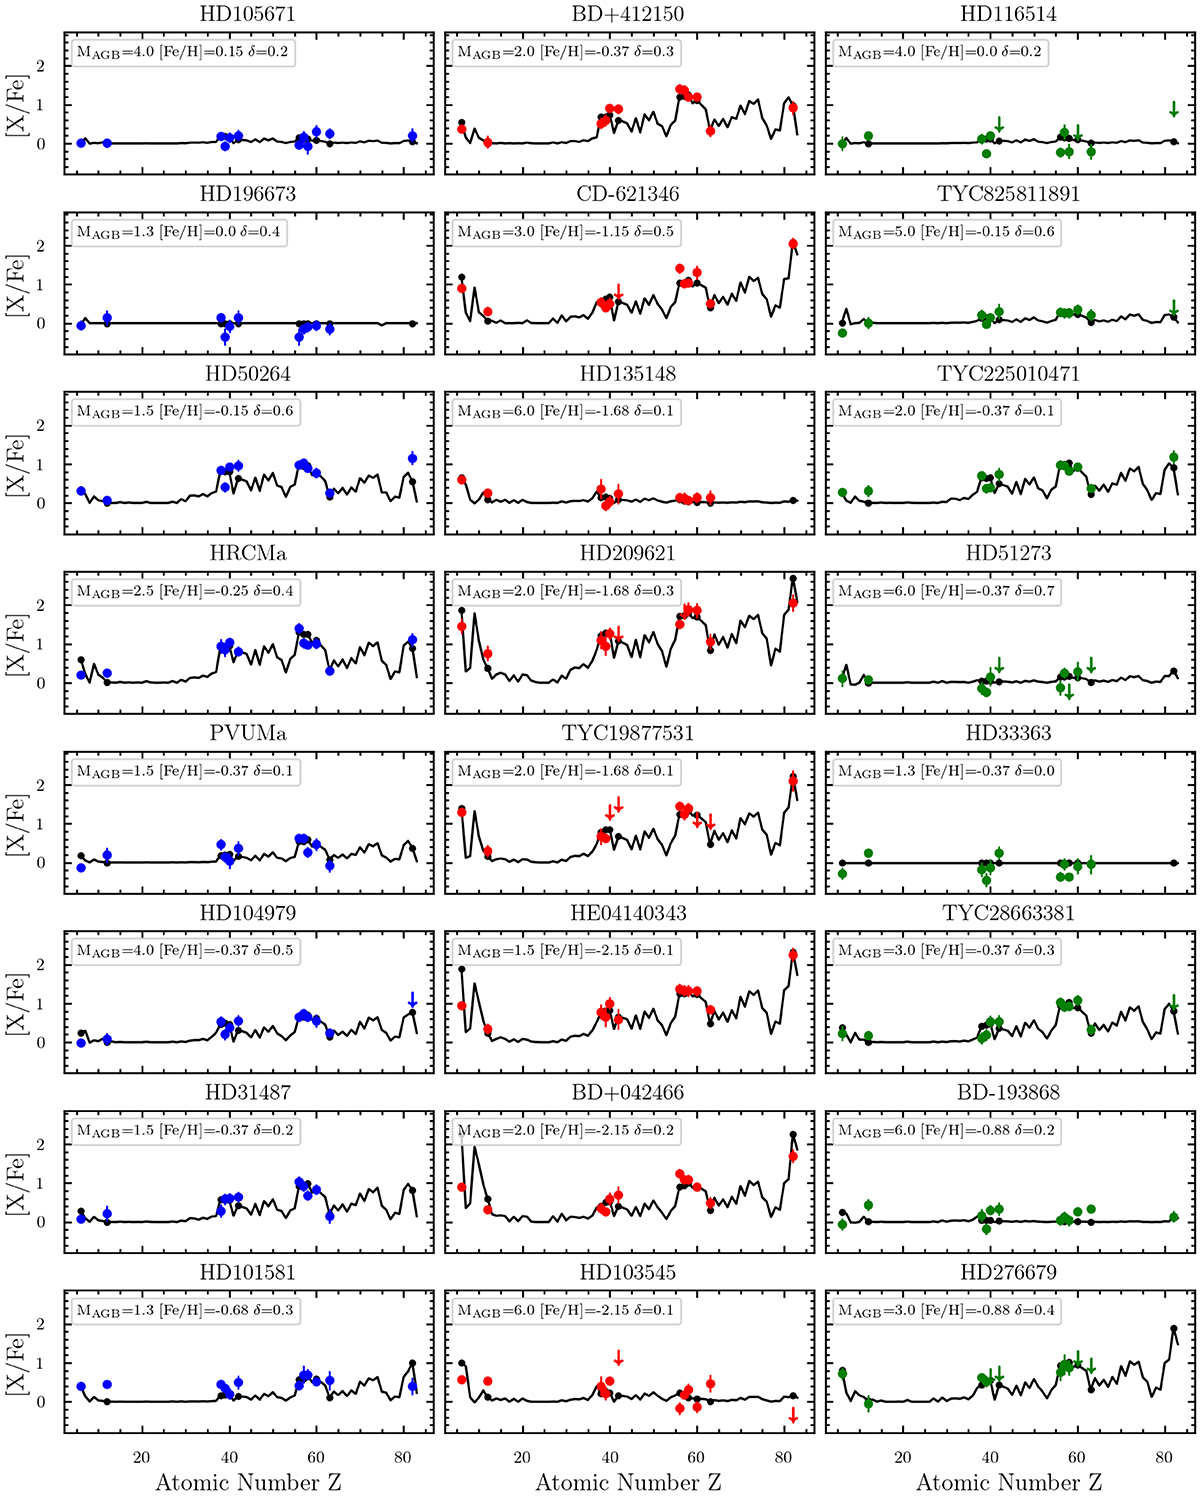
Fig. 10.
Download original image
FRUITY models compared to computed abundances for our high-quality abundance sample, organized by decreasing metallicity. Blue data points correspond to Ba stars, red to C-enriched stars, and green to “other” stars. Inverted triangles in the plots are upper limits from our abundance computations. FRUITY model data are shown in black.
Current usage metrics show cumulative count of Article Views (full-text article views including HTML views, PDF and ePub downloads, according to the available data) and Abstracts Views on Vision4Press platform.
Data correspond to usage on the plateform after 2015. The current usage metrics is available 48-96 hours after online publication and is updated daily on week days.
Initial download of the metrics may take a while.