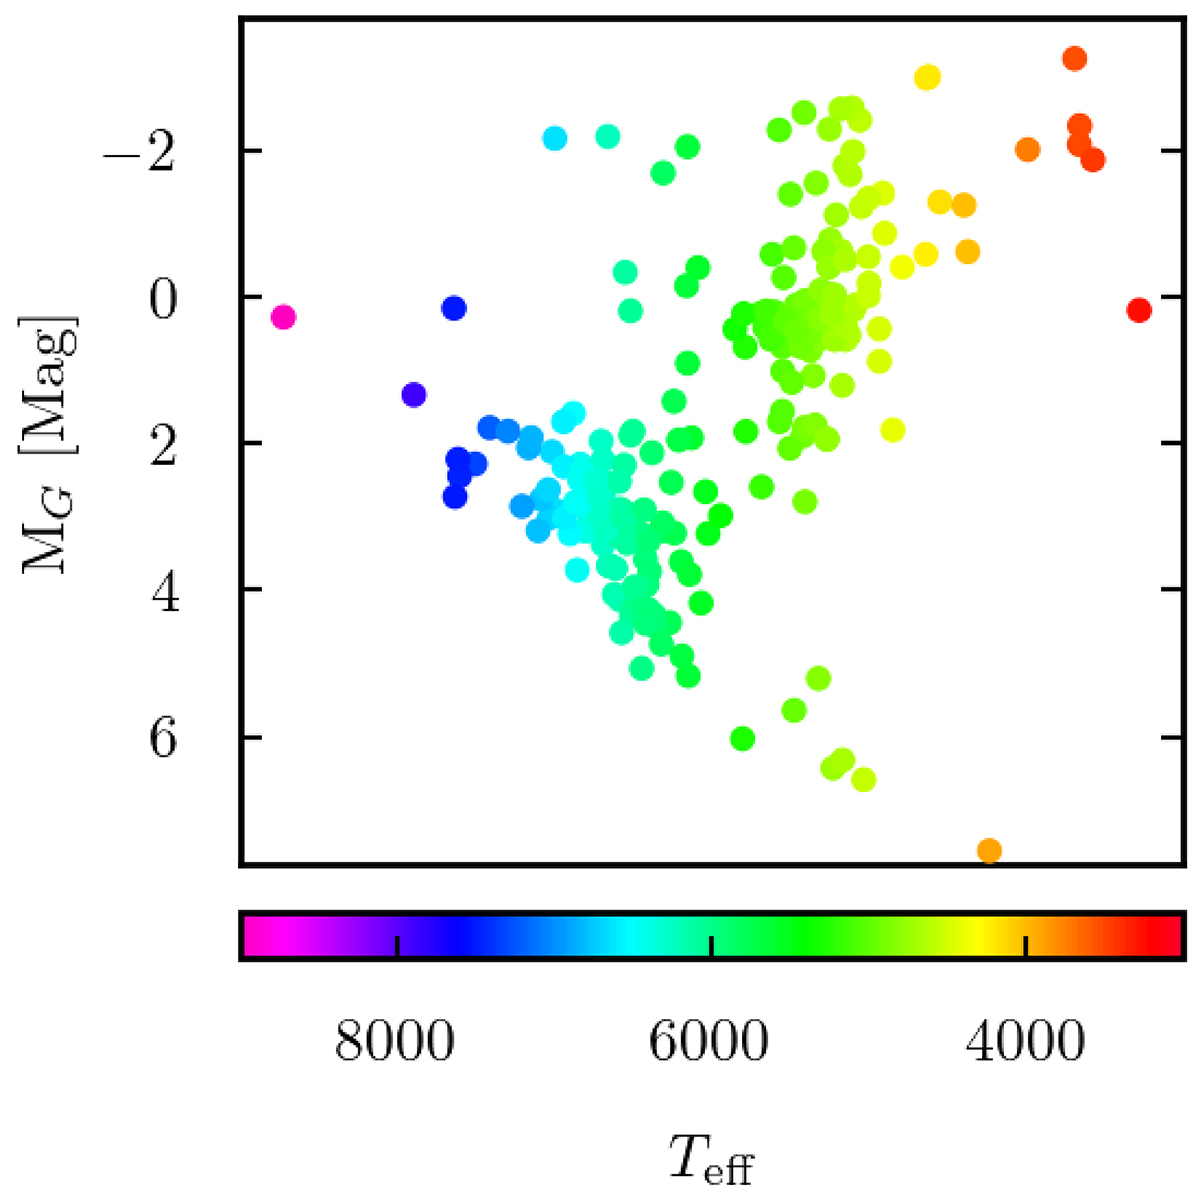
Fig. 1.
Download original image
Color–magnitude diagram for a representative group from our sample using Gaia photometric data and parallax. The color gradient follows temperature along the x-axis, with warmer objects in blue on the left and cooler objects in red on the right. Our full sample is generally split between main sequence dwarfs and giants, with temperatures ranging from 3500 to 8000 K.
Current usage metrics show cumulative count of Article Views (full-text article views including HTML views, PDF and ePub downloads, according to the available data) and Abstracts Views on Vision4Press platform.
Data correspond to usage on the plateform after 2015. The current usage metrics is available 48-96 hours after online publication and is updated daily on week days.
Initial download of the metrics may take a while.