Fig. 8
Download original image
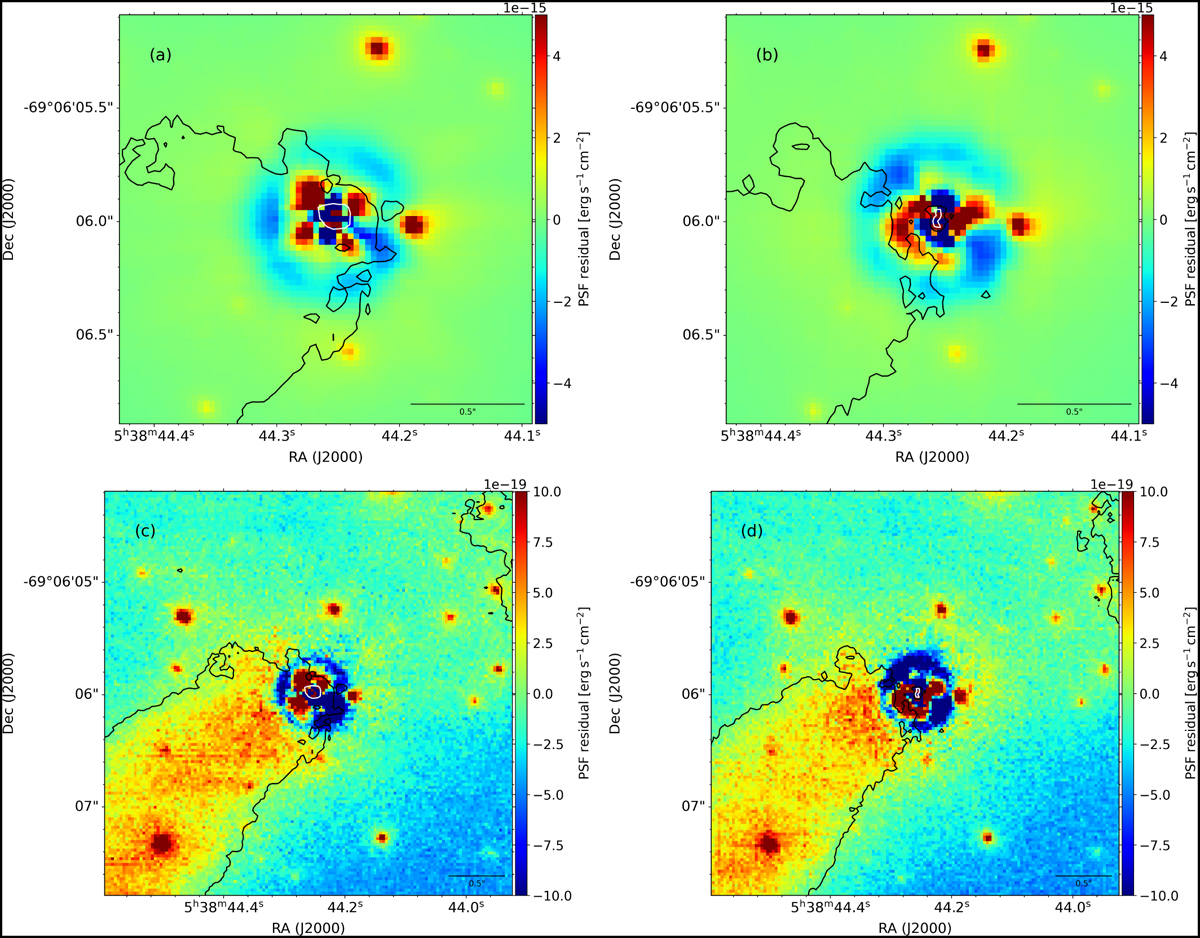
PSF residual maps. Panel a: total PSF residual in 2019. Panel b: total PSF residual in 2021. Panel c: PSF residual in 2019 at the position of [NII] λ 6583. Panel d: PSF residual in 2021 at the position of [NII] λ 6583. The path of [NII] λ 6583 intensity is highlighted by the edges in the [NII] λ 6583 contours displayed in Figs. 1 and 5, marking the detection within the ISM across all four panels.
Current usage metrics show cumulative count of Article Views (full-text article views including HTML views, PDF and ePub downloads, according to the available data) and Abstracts Views on Vision4Press platform.
Data correspond to usage on the plateform after 2015. The current usage metrics is available 48-96 hours after online publication and is updated daily on week days.
Initial download of the metrics may take a while.