Fig. 5
Download original image
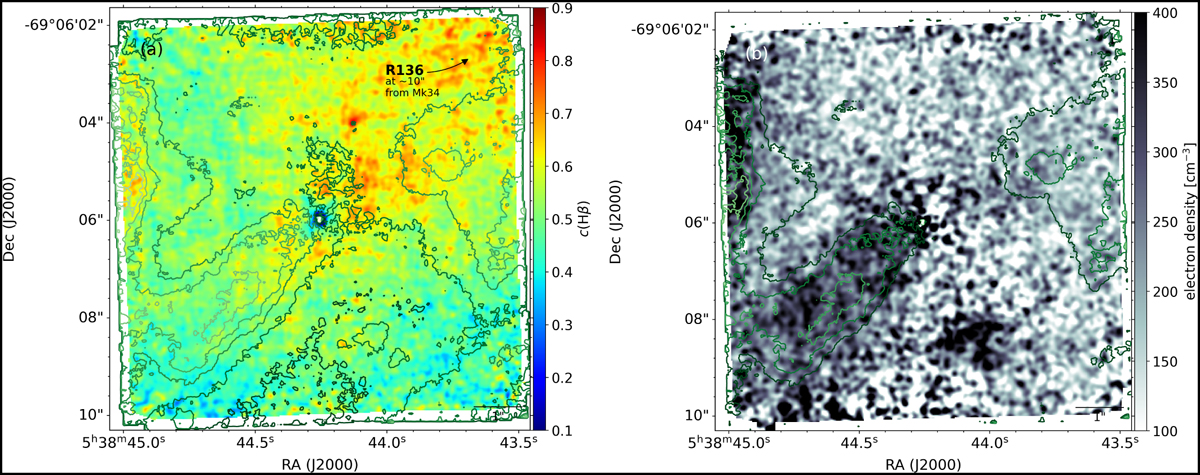
Reddening coefficient c(Hβ) (left panel) and electron density (right panel) maps extracted from the 2021 epoch. In the left panel, the fainter contours of [NII] λ 6583 emission are delineated (from 2 × 10⁻¹⁹ to 2 × 10⁻¹⁸ erg s−1 cm−2 in increments of 2 × 10⁻¹⁹ erg s−1 cm−2 per spaxel) in comparison with the depiction in Fig. 1. This adjustment was made to accentuate the observed correlation between large c(Hβ) values and the absence of [NII] emission in the northwest of Mk 34.
Current usage metrics show cumulative count of Article Views (full-text article views including HTML views, PDF and ePub downloads, according to the available data) and Abstracts Views on Vision4Press platform.
Data correspond to usage on the plateform after 2015. The current usage metrics is available 48-96 hours after online publication and is updated daily on week days.
Initial download of the metrics may take a while.