Open Access
Fig. 4
Download original image
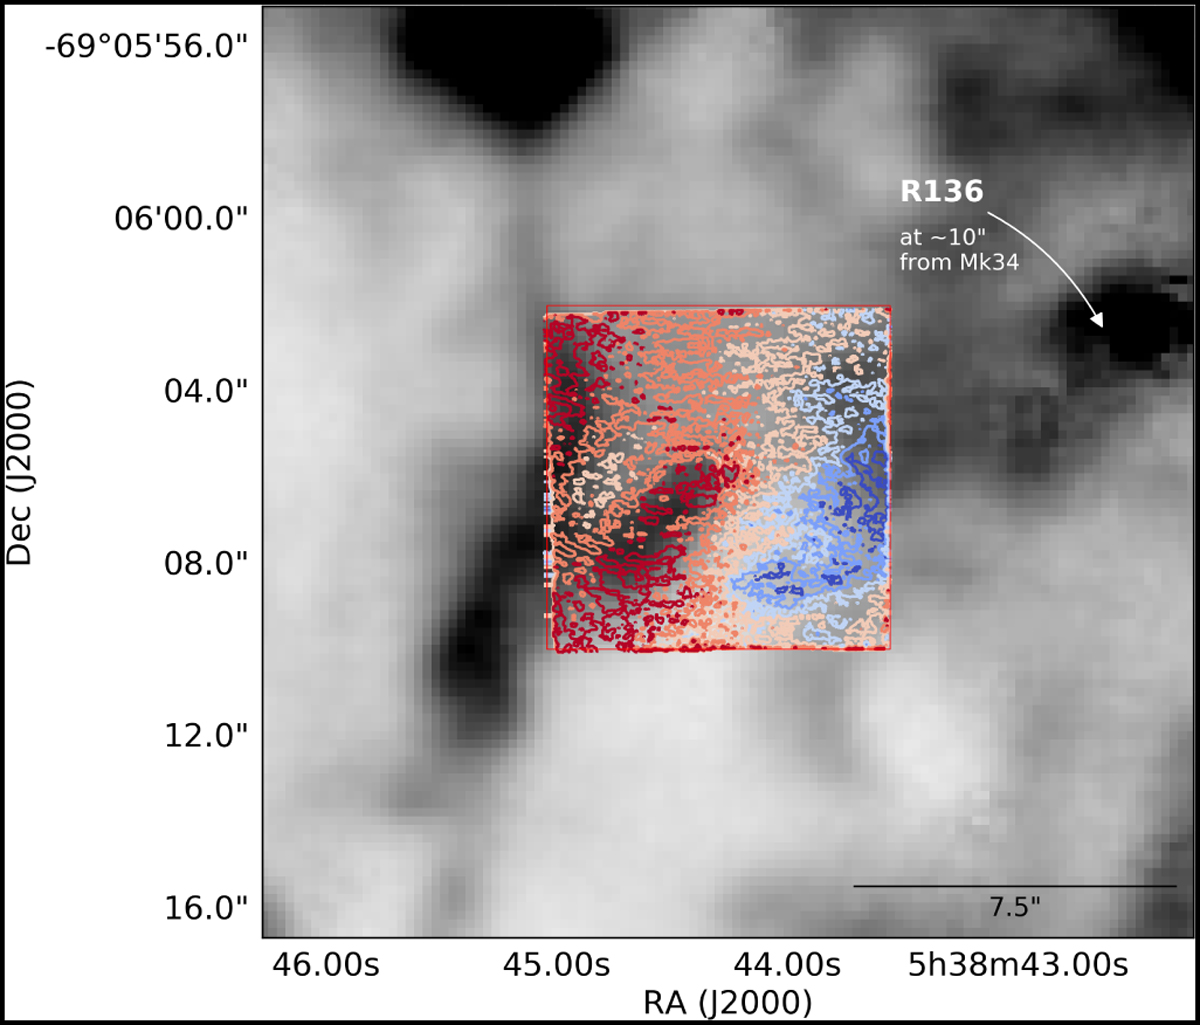
[NII] λ 6583 emission mapped as described in Fig. 3. The [NII] radial velocity mapped by MUSE-NFM is overplotted in red and blue contours. Contours range from −30 km s−1 (blue) to 30 km s−1 (red) in steps of 10 km s−1 (NGC 2070 systemic velocity has been subtracted). See Fig. 3 as a reference for the additional labels.
Current usage metrics show cumulative count of Article Views (full-text article views including HTML views, PDF and ePub downloads, according to the available data) and Abstracts Views on Vision4Press platform.
Data correspond to usage on the plateform after 2015. The current usage metrics is available 48-96 hours after online publication and is updated daily on week days.
Initial download of the metrics may take a while.