Fig. 3
Download original image
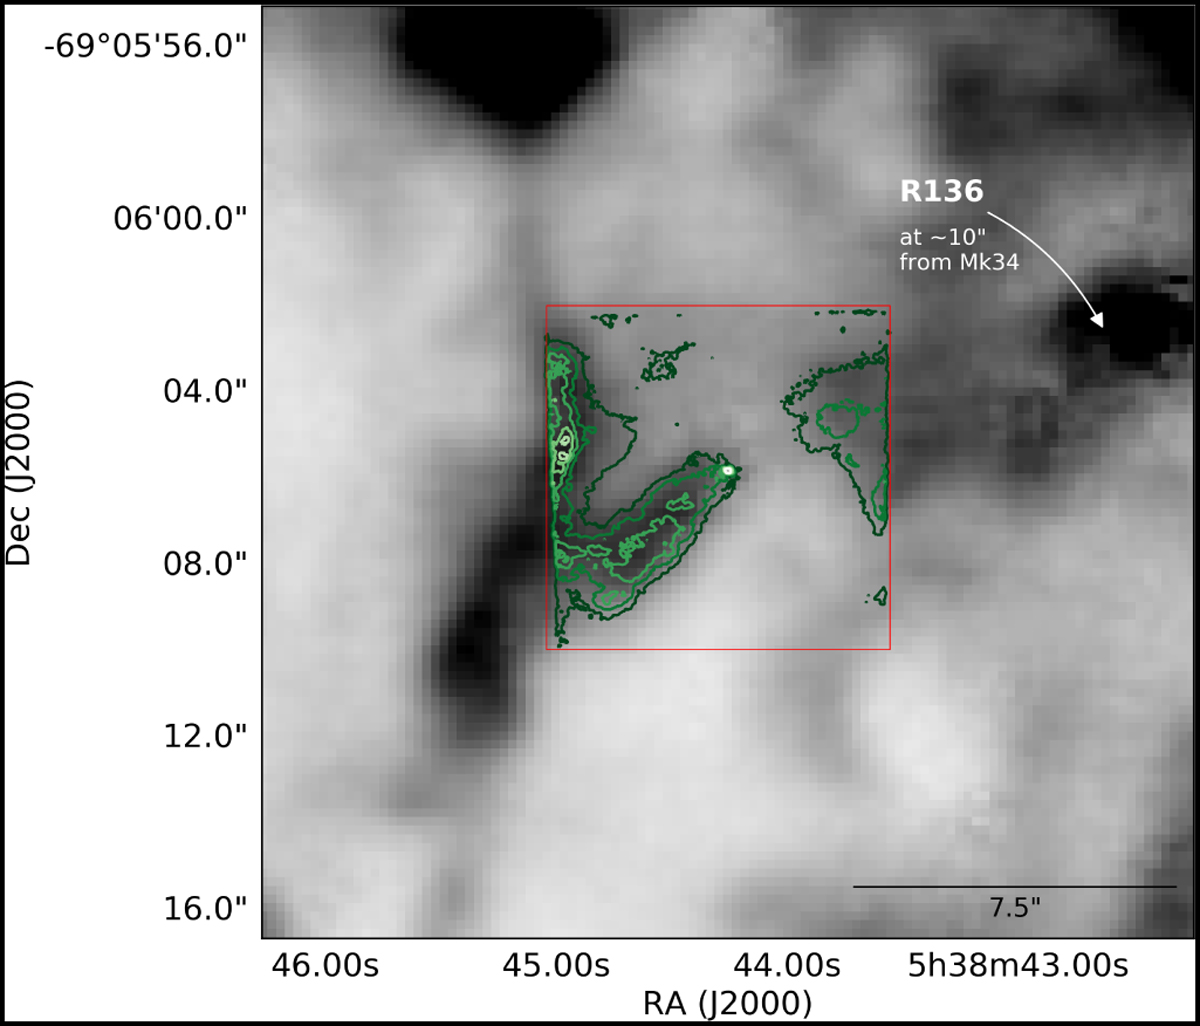
[NII] λ 6583 emission mapped by MUSE-WFM (Castro et al. 2018) around Mk 34 with a spatial resolution of approximately 1″. The [NII] λ6583 emission mapped by MUSE-NFM is overplotted in green contours (see Fig. 1). The MUSE-NFM data sample the emission with a spatial resolution of approximately 80 mas and a field of view of 7.5"×7.5" (red square). The cluster R136 is indicated toward the north-west side of the field.
Current usage metrics show cumulative count of Article Views (full-text article views including HTML views, PDF and ePub downloads, according to the available data) and Abstracts Views on Vision4Press platform.
Data correspond to usage on the plateform after 2015. The current usage metrics is available 48-96 hours after online publication and is updated daily on week days.
Initial download of the metrics may take a while.